
Sizing & Performance Notice: The benchmark results in this document serve as a performance baseline and sizing guideline measured under a controlled testing environment. Actual throughput may vary depending on deployment-specific factors, including network bandwidth, hardware specifications, database performance, and concurrent report ingestion rates. OPSWAT strongly recommends using these figures for initial capacity planning and conducting a site-specific benchmark to validate requirements for your production deployment.
This page summarizes a performance and load test of My OPSWAT Central Management (MOCM) version 10.6.x. The goal was to estimate resource utilization and disk growth of a MOCM server managing multiple enrolled MetaDefender Core and MetaDefender Kiosk instances under a sustained, high report-processing load.
Test Topology
Operating system: Microsoft Windows Server 2022 Standard (64-bit).
In each scenario, the MOCM server had the following instances enrolled and continuously reporting to it:
5 × MetaDefender Core instances
5 × MetaDefender Kiosk instances
Each Core instance generated a share of the target report load, which was aggregated and stored by the MOCM server. Each scenario ran continuously for 10 days to observe steady-state behavior and disk growth.
Environment
MOCM Server Configurations
Scenario | vCPU | Memory (GB) | Disk | OS |
|---|---|---|---|---|
S1 | 8 | 32 | 1 TB SSD | Windows Server 2022 Standard (64-bit) |
S2 | 12 | 48 | 1 TB SSD | Windows Server 2022 Standard (64-bit) |
S3 | 16 | 64 | 1 TB SSD | Windows Server 2022 Standard (64-bit) |
Disk Benchmark (common to all scenarios)
Sequential Read | Sequential Write | Random Read | Random Write |
|---|---|---|---|
271 MB/s | 273 MB/s | 77 MB/s | 75 MB/s |
Data Retention Settings (all scenarios)
Global data retention: 30 days
Do not store raw report data for allowed files: Enabled
Test Data Payload
In a production environment, when MetaDefender Core scans a file, the file is extracted into multiple sub-objects (e.g., a single .docx file may contain embedded images, text, and metadata), each generating its own scan report (referred to as a child report). Consequently, a single scanned file typically produces multiple child reports. All report counts in this document refer to child reports, not original scanned files.
In this test, child reports were simulated using standard production payload structures and an average size of ~6 KB per object, rather than generated via live scans on Core instances. This isolates the performance measurement specifically to the MOCM server.
Reports were submitted in batches of 10,000 child reports (approximately 60 MB per batch).
Test Scenarios
Three report load levels were tested against the same 5 Core + 5 Kiosk topology, each on a MOCM server sized for the target load:
Scenario | Enrolled in MOCM | Total report load | Reports/hr per Core | Duration | MOCM server specs |
|---|---|---|---|---|---|
S1 | 5 Core + 5 Kiosk | 1 million reports/hr | 0.2 million/hr | 10 days | 8 vCPU, 32 GB RAM, 1 TB disk |
S2 | 5 Core + 5 Kiosk | 3 million reports/hr | 0.6 million/hr | 10 days | 12 vCPU, 48 GB RAM, 1 TB disk |
S3 | 5 Core + 5 Kiosk | 5 million reports/hr | 1 million/hr | 10 days | 16 vCPU, 64 GB RAM, 1 TB disk |
Measurement Results
Resource utilization (CPU, RAM, Disk IO) is reported as minimum/maximum/average over the full 10-day run. Disk figures capture the database and report-storage footprint on the MOCM server.
Scenario | CPU % (min/max/avg) | RAM % (min/max/avg) | Disk IO % (min/max/avg) | Disk start / end | Disk growth/hour | Disk growth/month |
|---|---|---|---|---|---|---|
S1 | 2.4 / 83.6 / 18.6 | 35.5 / 87.5 / 80.5 | 0.0 / 100.0 / 14.5 | 37.47 / 115.83 GB | 0.327 GB/hr | 235.1 GB/month |
S2 | 2.1 / 85.2 / 28.4 | 23.4 / 84.3 / 79.1 | 0.0 / 100.0 / 38.5 | 40.5 / 278.5 GB | 0.97 GB/hr | 698.4 GB/month |
S3 | 2.6 / 81.6 / 24.9 | 19.1 / 82.7 / 73.2 | 0.0 / 100.0 / 43.6 | 42.28 / 449.15 GB | 1.695 GB/hr | 1220.6 GB/month |
System Resource Utilization Charts
1 million reports/hr
Metric | Chart |
|---|---|
CPU usage | 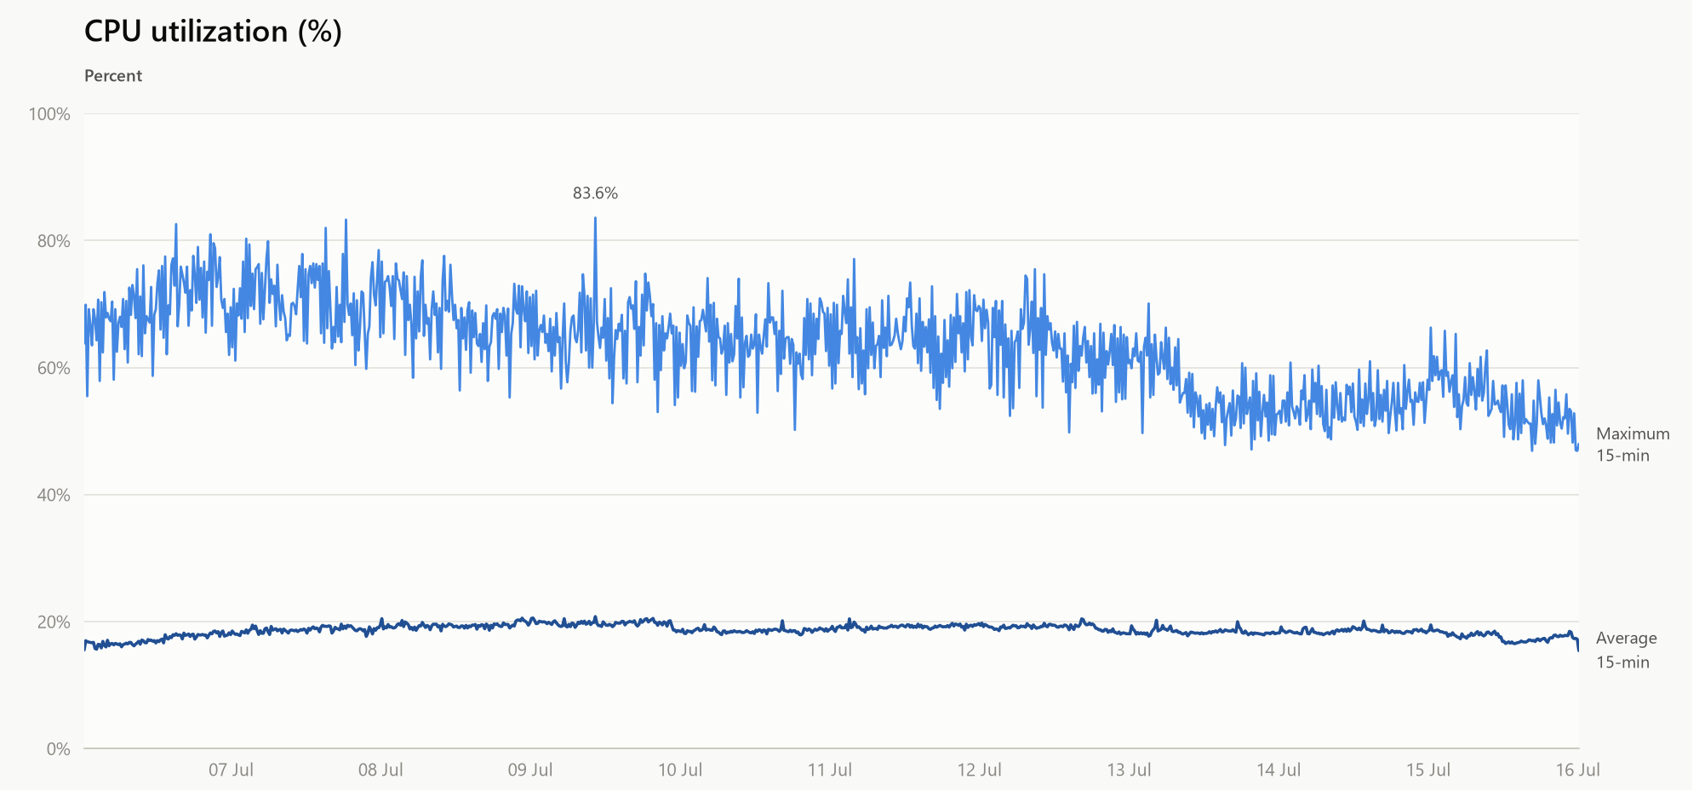 |
Memory usage | 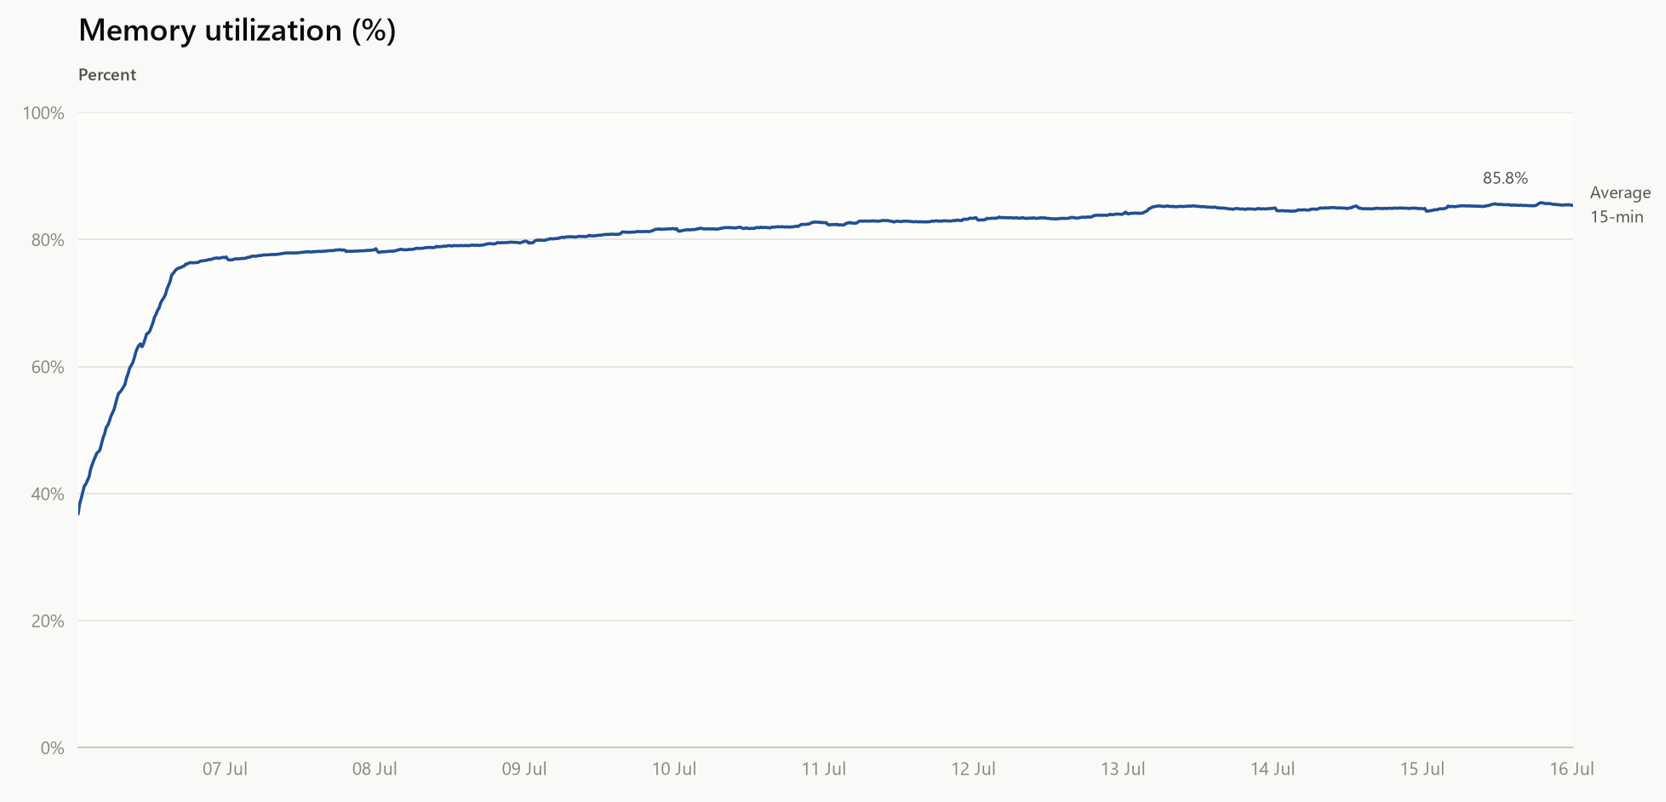 |
Disk usage | 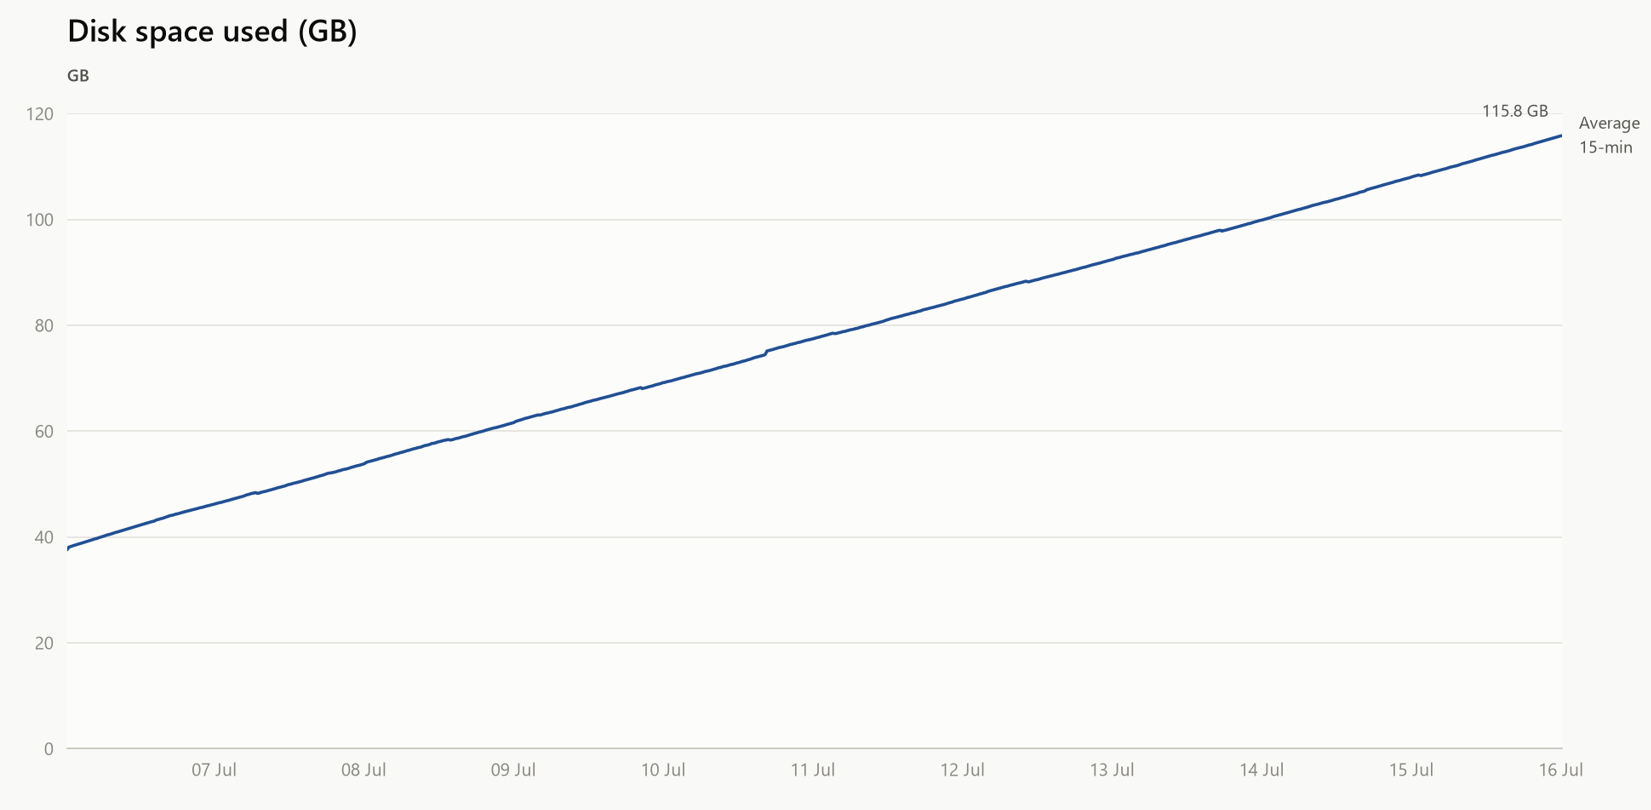 |
3 million reports/hr
Metric | Chart |
|---|---|
CPU usage | 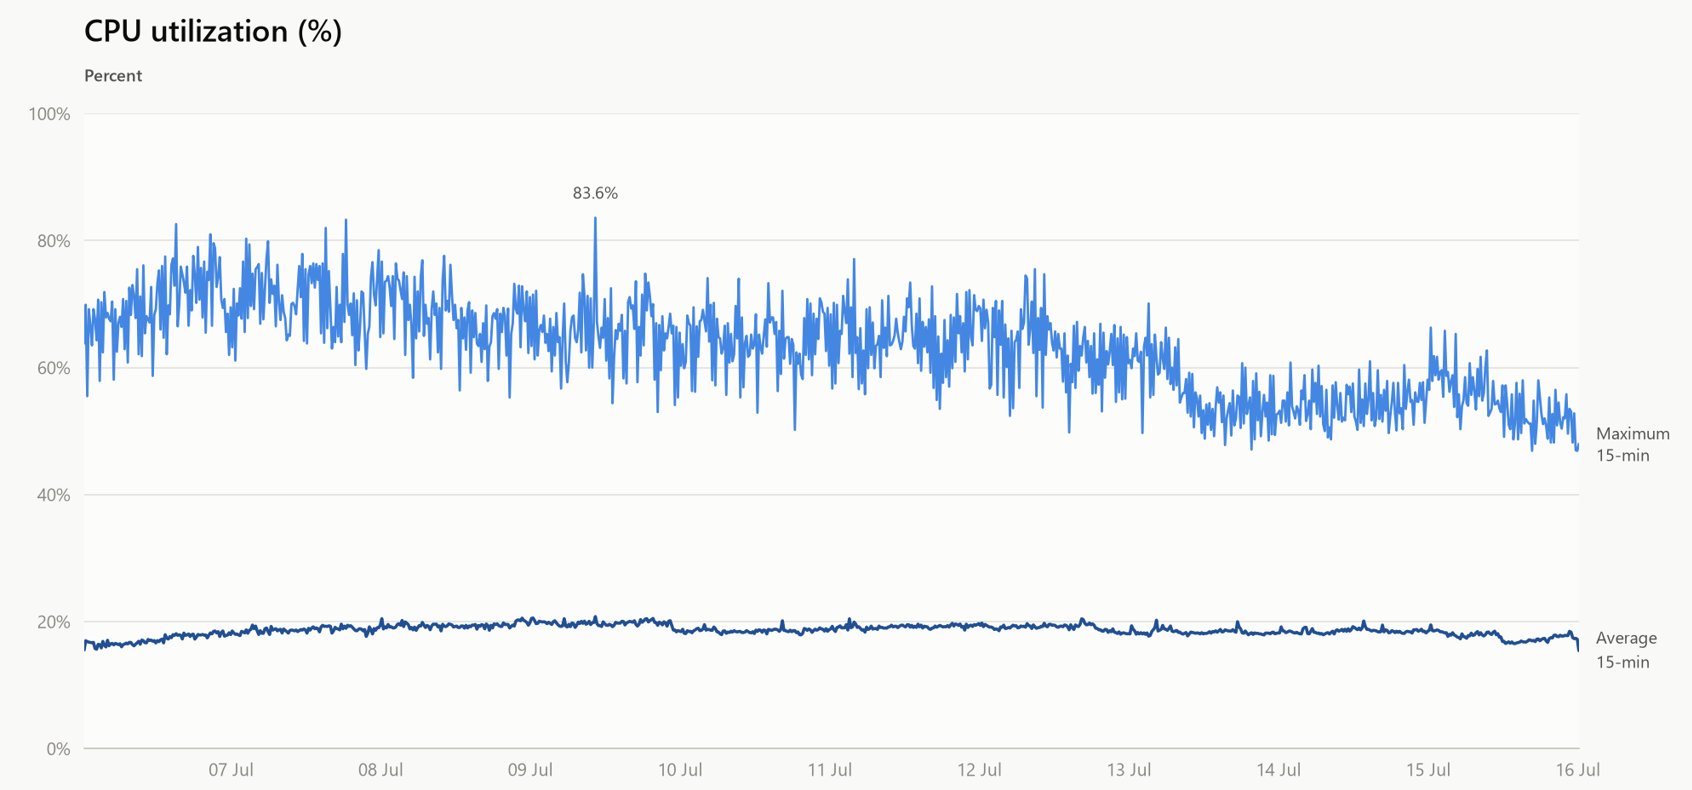 |
Memory usage | 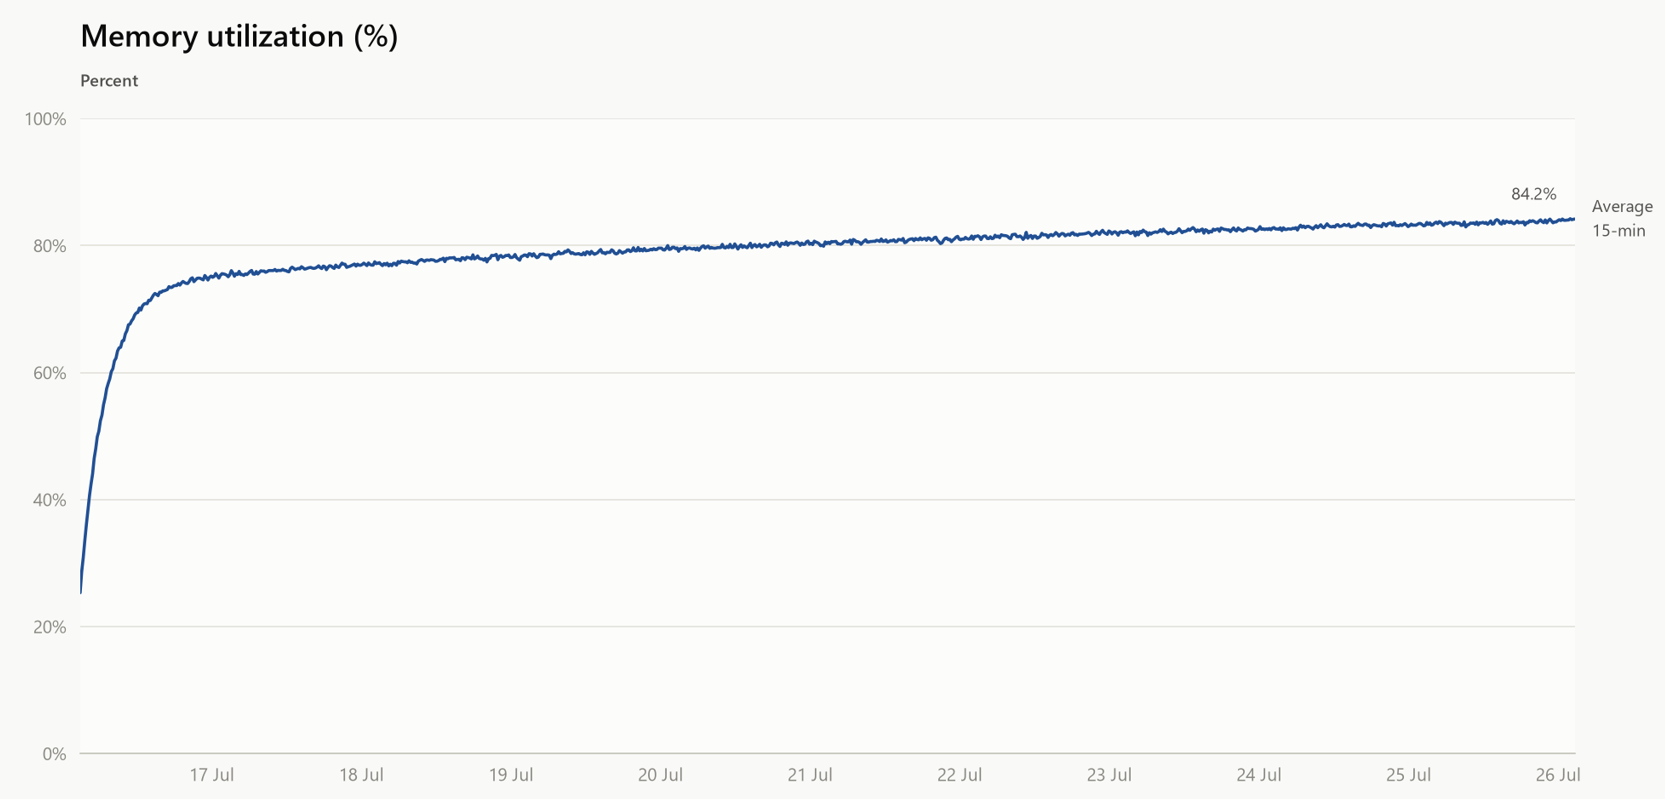 |
Disk usage | 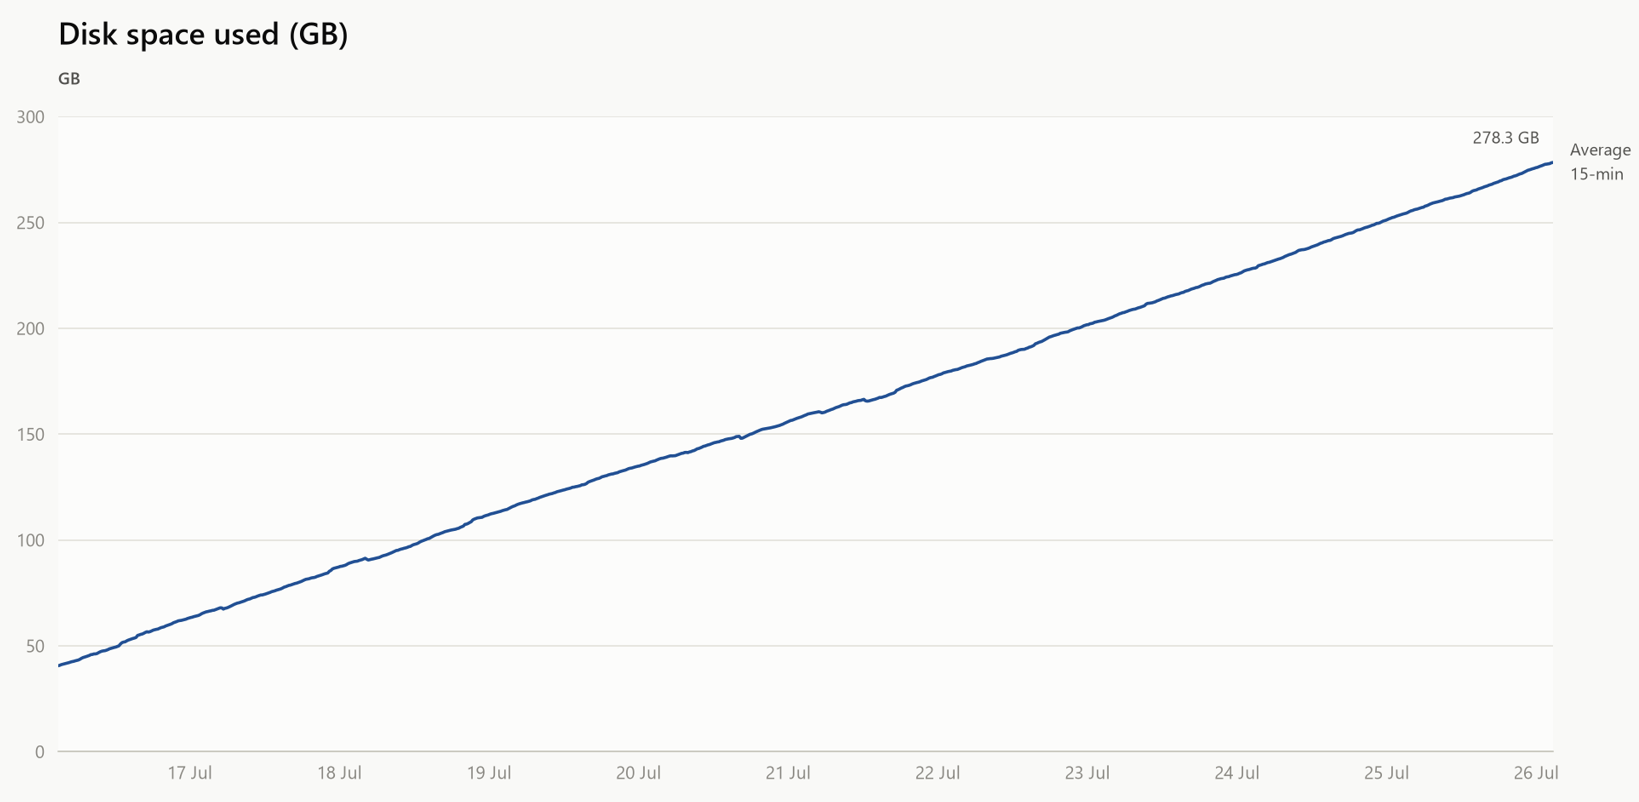 |
5 million reports/hr
Metric | Chart |
|---|---|
CPU usage | 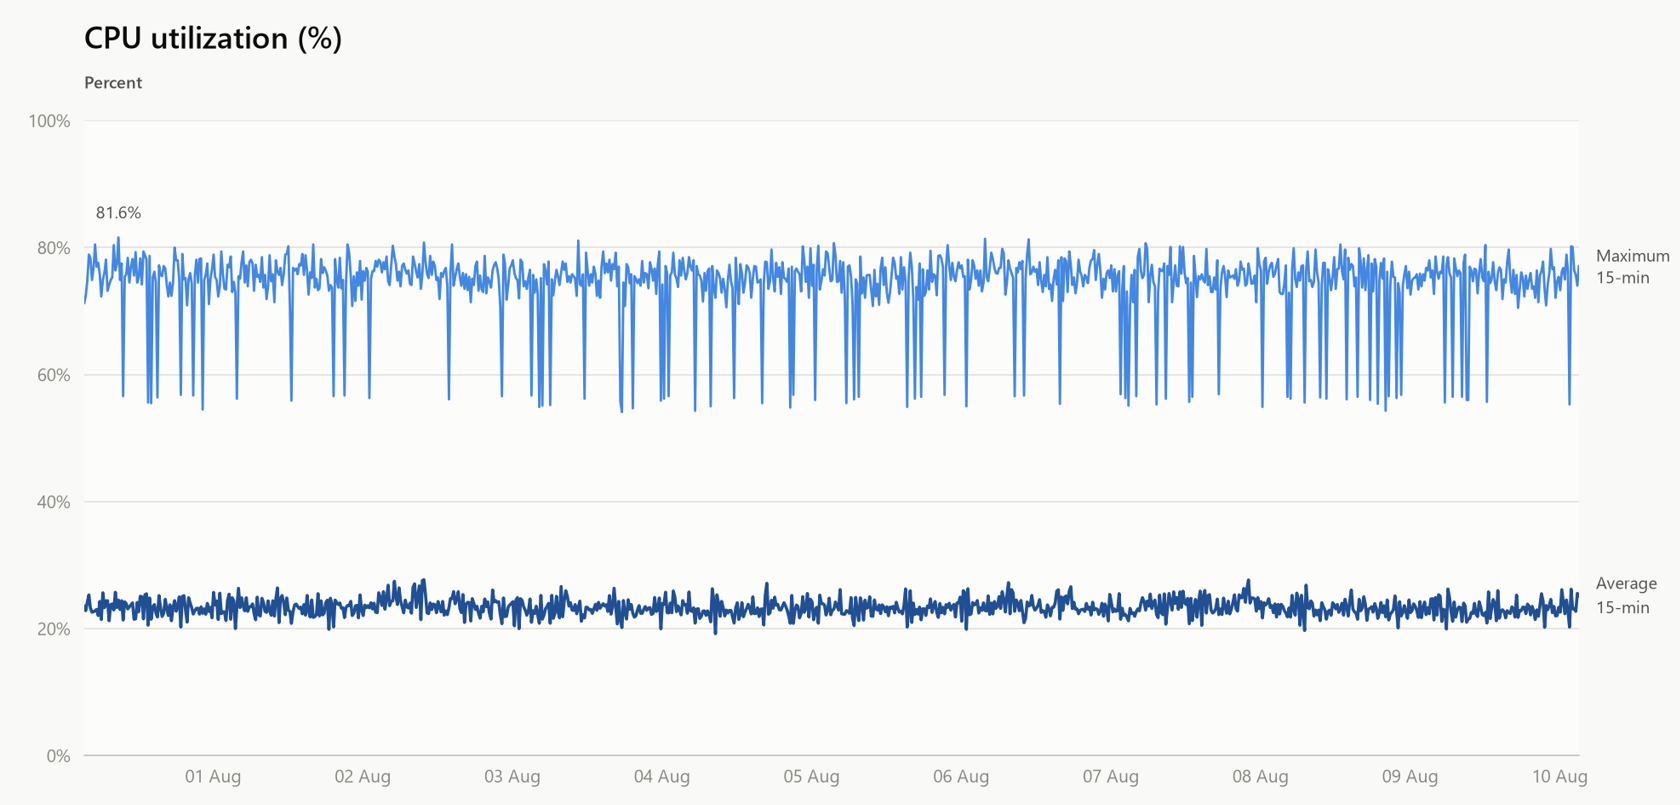 |
Memory usage | 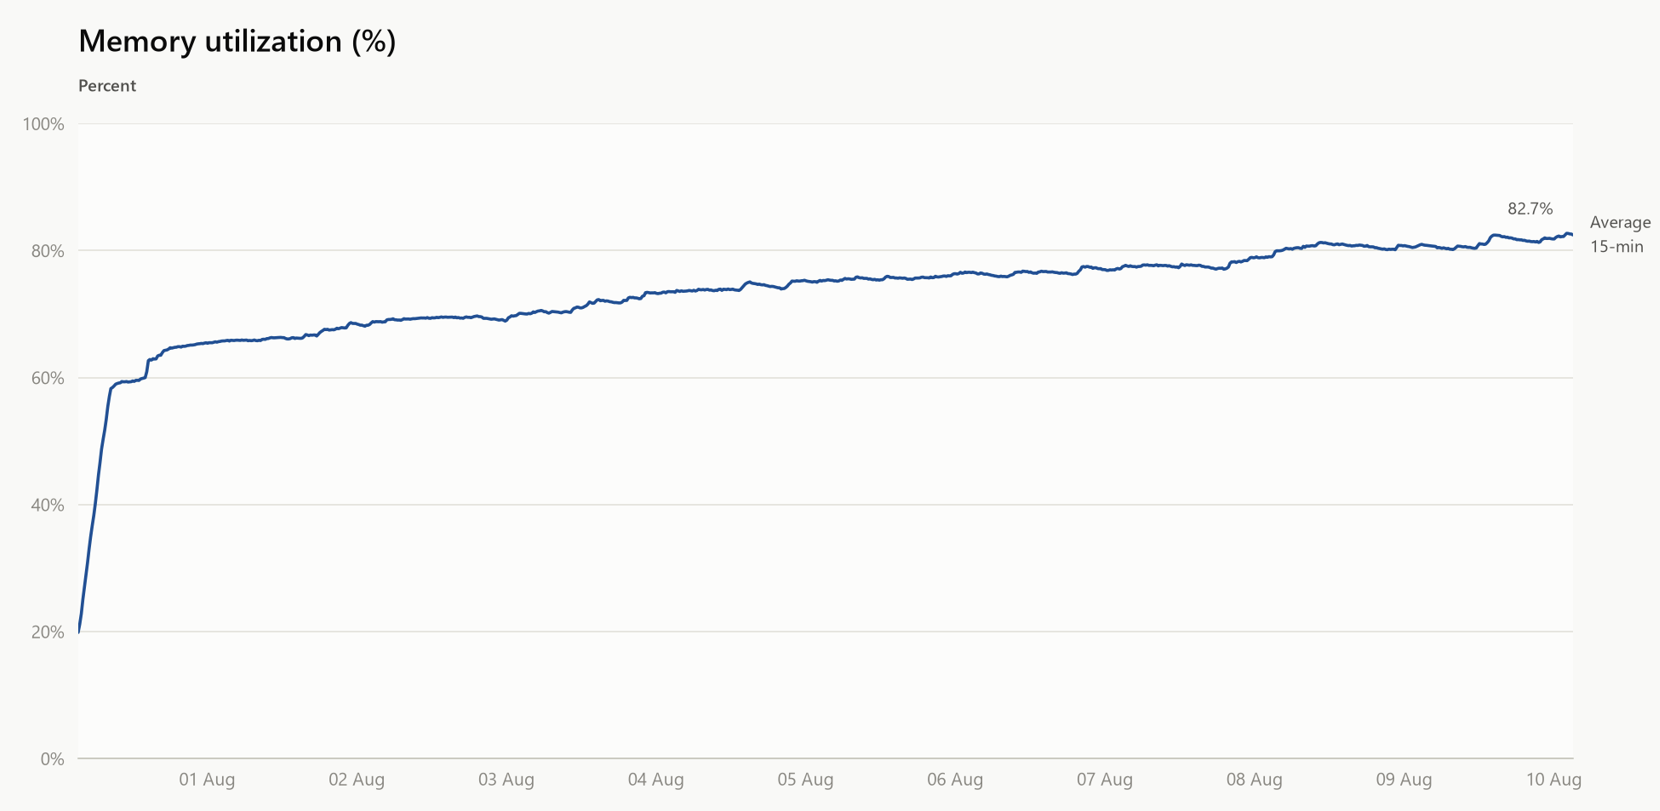 |
Disk usage | 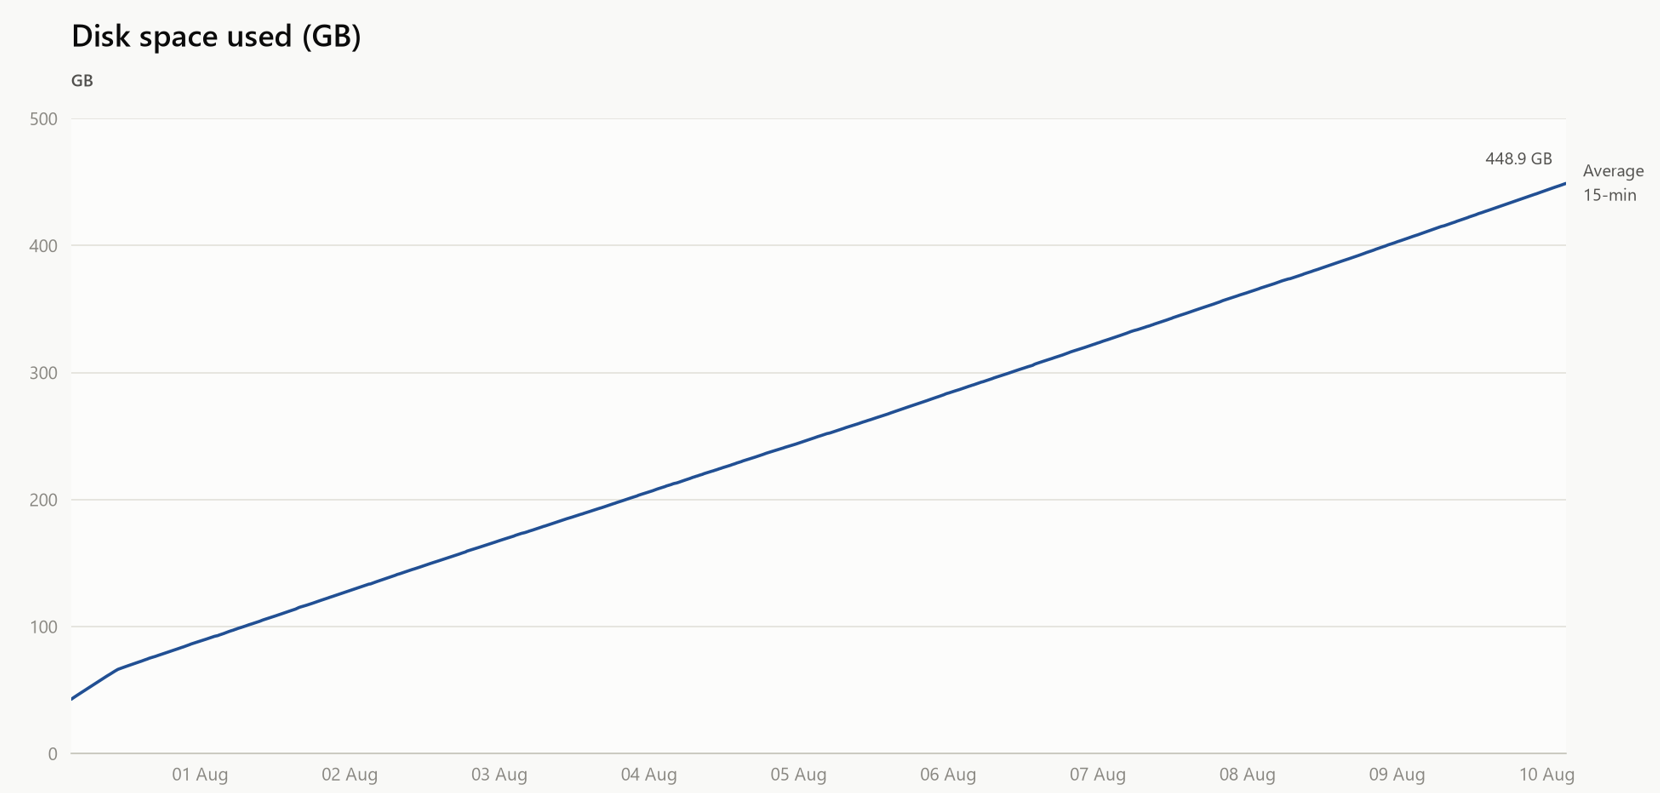 |
Observations
CPU utilization stayed low on average (18.6% for S1, 28.4% for S2, 24.9% for S3) with short peaks under load, indicating headroom on all configurations.
RAM utilization stabilized at a high average (~73–80%) across scenarios; memory is the primary resource to size for when scaling report load.
Disk growth scales with report volume: roughly 235 GB/month at 1 million reports/hr (S1), 698 GB/month at 3 million reports/hr (S2), and 1,221 GB/month at 5 million reports/hr (S3). Provision disk capacity and a data-retention policy accordingly.