
MetaDefender NDR's ML family does not know in advance what malicious traffic looks like. It learns the shape of this network's DNS, HTTP, and flow telemetry as the telemetry streams past. Then it raises an alert on an event whose shape is isolated from prior events. The family catches novel, unsigned, undeclared activity. This differs from signature, intelligence-feed, and multi-antivirus families. It runs continuously without labeled data, human supervision, or a separate train phase. This chapter explains how the Random Cut Forest (RCF) engine scores events. It also explains what the engine raises and how operators tune it.
First-use acronym expansions in this chapter:
ML -- machine learning.
RCF -- Random Cut Forest.
RRCF -- Robust Random Cut Forest, the online-learning variant in MetaDefender NDR.
DNS -- Domain Name System.
HTTP -- Hypertext Transfer Protocol.
TLS -- Transport Layer Security.
SNI -- Server Name Indication.
JA3 and JA3S -- TLS client and server fingerprint hashes.
NXDOMAIN -- Non-Existent Domain DNS response.
TTL -- Time-to-Live.
TCP -- Transmission Control Protocol.
SYN / ACK / FIN / PSH / RST -- TCP control flags.
IP -- Internet Protocol.
IOC -- Indicator of Compromise.
C2 -- command-and-control.
DGA -- Domain Generation Algorithm.
FIFO -- first-in-first-out eviction.
CIDR -- Classless Inter-Domain Routing.
UI -- user interface.
FRD -- Functional Requirements Document.
MVP -- Minimum Viable Product.
PostMVP -- features deferred beyond MVP.
What it is
The ML anomaly family is an unsupervised anomaly detector built on the Robust Random Cut Forest algorithm. The service maintains one independent RCF detector per event type: one for DNS, one for HTTP, and one for Flow. It scores every merged event against the detector that matches its Suricata event type. Each detector is a forest of Random Cut Trees. These trees partition a feature space with random cuts. Events in sparse regions of the forest receive a high anomaly score. Events that cluster with many others receive a low score. The detector learns continuously. Every event that it scores also updates the forest. Thus, the model tracks the network as it changes day over day.
Operators never train the model offline. There is no labeled dataset, no train phase, and no scheduled retrain. The detector warms up inside the first few hundred events it sees. The service discards scores on the first events after a cold start. The detector improves its separation as live traffic streams in. When a detector scores an event above the configured per-type threshold, the service emits an ML anomaly alert. The alert carries the score, crossed threshold, model version, and original event. Analysts can pivot straight into the trigger record without leaving the alert.
The family's value complements every other detection engine. Suricata signatures match on known packet content. The C2 and InSights families match on curated threat intelligence. MetaDefender Core scans extracted files. The behavioral family detects specific named traffic shapes, such as beaconing, exfiltration, and tunneling. The ML family catches the long tail. These events have shapes that do not fit prior events in this network. This applies regardless of whether any rule or feed recognizes them.
What it detects
The family surfaces deviations from learned baselines rather than named threats. Typical findings fall into four loose categories.
Novel command-and-control infrastructure. Beacon check-ins, non-standard TLS handshakes, and unfamiliar DNS patterns originating from a compromised host that no signature or IOC feed has yet catalogued. The RCF detector does not need to know the destination is malicious -- it only needs the event to look isolated relative to the network's learned norm.
DNS misuse and DGA activity. Query-rate bursts, high NXDOMAIN ratios, anomalous query-type distributions, unusual TTL variability, unusually long or deeply-subdomained names, and n-gram patterns consistent with Domain Generation Algorithms. The DNS detector combines query and answer counts, the event's hour, and upstream feature context to isolate DNS shapes the network rarely produces.
TLS client or server profile anomalies. Unfamiliar JA3 or JA3S fingerprints, deprecated cipher preferences, short-validity or self-signed certificates, unusual extension orders or Server Name Indication patterns. The detector baselines TLS features alongside DNS and flow characteristics. These features contribute to the per-event score when a flow has an atypical TLS handshake.
Flow-level rarity. Byte and packet asymmetries, uncommon port or protocol combinations, and temporal patterns that the detector's sliding window has not seen before. Flow anomalies correlate strongly with exfiltration staging, lateral-movement probes, and tooling traffic from non-standard clients.
The family does not explain why an event is anomalous. It highlights events that need a closer look. The analyst uses the Hunt page per-protocol sidebar sections to read the underlying DNS, HTTP, TLS, or flow record. The analyst decides whether the anomaly is malicious, benign-but-unusual, or a model warmup artifact. A newly-deployed service that starts can be benign-but-unusual.
How it works
Each RCF detector runs a small, fixed pipeline per event.
Extract features.
The detector converts the incoming merged event into a 15-dimensional numeric feature vector. It normalizes the vector to the unit interval. Thus, features of different scale contribute evenly. Examples include bytes, hours, and boolean flags. The flow block contributes bytes-to-server, bytes-to-client, packets-to-server, packets-to-client, and flow age. It also contributes an alert boolean and the flow start hour and minute. The TCP block contributes five boolean flags: SYN, ACK, FIN, PSH, and RST. The HTTP block contributes status code and response length. The DNS block contributes query count and answer count. A temporal feature carries the hour of the event timestamp.
Create the shingle.
The detector concatenates the last three feature vectors into a sliding window, the shingle. This produces a 45-dimensional point. The point encodes the current event and recent context. Thus, the model can catch temporal patterns. These are sequence anomalies instead of single-event anomalies.
Score the shingle.
The detector inserts the shingle into the forest of Random Cut Trees. It scores the shingle on co-displacement. Co-displacement measures how much the tree structure changes when the point is removed. Events in dense regions score low. The forest barely changes when these events leave. Events in sparse regions score high. Their removal visibly simplifies the forest. The score is a non-negative floating-point value.
Adjust the whitelist.
Before threshold comparison, an infrastructure-aware whitelist can reduce the score. The whitelist ships with patterns for MetaDefender NDR platform traffic, Kafka, PostgreSQL, service-discovery and pod-network IPs, multicast, and broadcast. It also ships with a short allowlist of common internal endpoints. For matching events, the detector multiplies the score by a fractional reduction factor (0.4 to 0.9). Or, the detector excludes the event entirely. The alert payload preserves whitelist action, reduction factor, and pre-adjustment score. Thus, analysts can see the raw score.
Compare the threshold and emit the alert.
The detector compares the adjusted score to the per-event-type threshold: 3.0 for DNS, 8.0 for HTTP, 20.0 for Flow. It emits events above the threshold as ML anomaly alerts on the streaming ML alerts stream. It drops events at or below the threshold.
Update the online model.
Whether or not the event alerted, the forest evicts its oldest shingle and inserts the current one. This keeps each detector memory bounded. The default is 128 points per tree, across 20 trees per detector. This makes the family online. The forest continuously re-learns normal behavior and adapts to gradual network change.
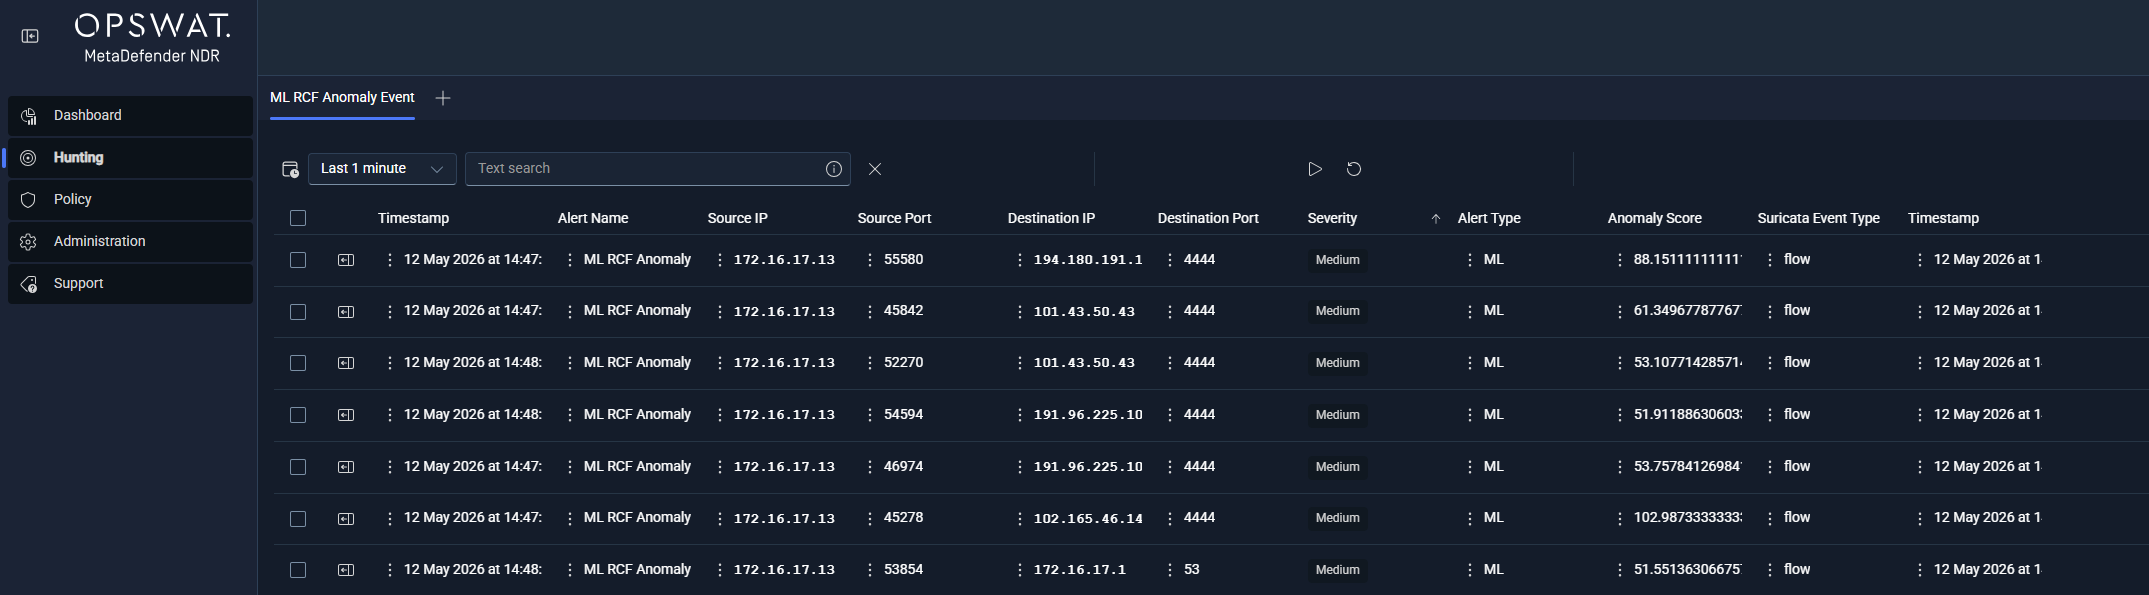
The alert engine picks up the ML alerts stream. It runs its pass-through MLAnomalyDetection rule. It stamps the alert at unified Medium severity. Then it publishes the alert to the Hunt page and Dashboard with every other alert. On the Hunt page, the alert row carries the anomaly score and threshold as columns. The sidebar renders the original event verbatim. Thus, the analyst can read the DNS, HTTP, or flow record that triggered the score.
Remember three process details for the rest of this chapter. First, detector memory is bounded. Older patterns leave the forest as new ones arrive. Thus, a rare traffic type that suddenly becomes common can score high at first. Examples include a newly-deployed service or a network migration. The score becomes low after the forest learns it. Second, the forest is per-event-type. DNS rarity does not influence HTTP scores. Third, the family does not assign its own severity on MVP. The alert engine pass-through rule stamps every ML anomaly at Medium. Then the usual IOC auto-escalation rule takes over.
Trigger conditions
An ML anomaly alert fires when a detector's post-whitelist score exceeds its per-event-type threshold. The fields below are what analysts read when triaging the alert.
Field | Meaning |
|---|---|
| The per-event anomaly score after whitelist adjustment. Floating-point, non-negative. A score of 3.5 on a DNS event is barely above threshold; a score of 20 on the same event is extreme. |
| The per-event-type threshold the score crossed (DNS 3.0, HTTP 8.0, Flow 20.0 by default). Present on every alert so analysts see the boundary without memorizing it. |
| The original Suricata event type that was scored -- |
| Present only when the whitelist reduced the score. Shows the raw score before reduction so analysts can see how aggressively the whitelist is smoothing traffic. |
| Present only when the whitelist matched. Typically |
| Present only when the whitelist reduced the score. A value between 0.4 and 0.9 -- the factor the original score was multiplied by. |
| Identifier of the RCF model that produced the score. Lets analysts group alerts by model era when the configuration changes. |
| Semantic version of the model (for example, |
| Identifier for the detector configuration -- |
| The identifier of the original Suricata event that scored anomalous. Use this to pivot to the full event in the Hunt page. |
| Timestamp of the original anomalous event (not the scoring time). |
| The full merged event payload -- DNS, HTTP, TLS, flow, or alert block -- that was scored. Rendered in the sidebar via the standard per-protocol sections when present. |
A single merged event produces exactly one ML anomaly alert when its score crosses the threshold; there is no per-entity reduction like MetaDefender Core's positive-engine maximum. When multiple events in quick succession all score high, each event raises its own alert. A host burst of anomalous DNS queries is one example. Analysts who work the queue see the cluster and pivot back to the shared source IP.
Severity classification
On MVP, the ML family does not assign its own native severity. The alert engine's pass-through MLAnomalyDetection rule sets every emitted alert at Medium regardless of the score value. Severity rises only when the IOC auto-escalation rule applies.
Trigger | Unified Serverity |
|---|---|
Event crosses the per-event-type score threshold (DNS >= 3.0, HTTP >= 8.0, Flow >= 20.0) and no IOC intersection applies. | Medium |
The anomalous event's source, destination, or queried domain coincides with a C2 feed hit or an InSights Threat Intelligence Database or Reputation Database match. | Critical (IOC auto-escalation) |
This conservative choice is deliberate. The raw anomaly score is a good rank signal but a weak absolute-magnitude signal. A score of 3.5 on DNS is near the threshold. A score of 20 on DNS is extreme. Comparable scores on HTTP or Flow mean different things because the thresholds differ. MVP does not project the score onto a severity ladder that needs per-event-type calibration. It stamps every ML anomaly at Medium. It relies on unified IOC auto-escalation and the analyst queue order to drive priority. See Confidence Scoring below.
The IOC auto-escalation rule described in Detection Overview promotes an ML anomaly alert to Critical / 0.99 confidence when any of the event's entities coincide with a C2 or InSights match. An anomalous DNS query to a known DGA domain on the C2 feed becomes a Critical alert; an anomalous HTTP flow to a REPDB-listed host becomes a Critical alert. The matched indicator is visible in the companion C2 Enrichment or InSights Enrichment sidebar section so analysts can see which feed drove the escalation.
Confidence scoring
Confidence on ML anomaly alerts maps the adjusted score onto the unified confidence scale from Detection Overview. Thus, analysts can order work inside the Medium severity band without raw score comparison across event types. The bands below give general interpretive guidance. Scores of 3.0 on DNS, 8.0 on HTTP, and 20.0 on Flow all sit at the floor of the low-confidence band. They barely crossed their respective thresholds.
Trigger | Alert Confidence |
|---|---|
IOC auto-escalation fires for this alert. | 0.99 |
Score is at least three times the per-event-type threshold -- an extreme anomaly the forest considers isolated by an order of magnitude. | 0.90 |
Score is between two and three times the per-event-type threshold -- strongly anomalous. | 0.80 |
Score is between 1.3 and two times the per-event-type threshold -- moderately anomalous. | 0.65 |
Score is between 1.0 and 1.3 times the per-event-type threshold -- at the minimum, likely deserves context before acting. | 0.50 |
The 0.99 band is reserved for IOC auto-escalation, consistent with every other detection family. In a well-tuned deployment, most alerts land in the 0.50 band. After RCF detectors warm up and the whitelist learns the environment infrastructure, extreme-score alerts become less frequent. Most day-to-day alerts cluster near their threshold. Analysts who order the queue inside the Medium severity band work the 0.90 to 0.80 alerts first. They use the 0.65 to 0.50 alerts as corroborating context, not as standalone priorities.
Where it surfaces
ML anomaly alerts appear in four places.
Dashboard -- Recent Severities donut. Every ML anomaly alert contributes to the Medium slice on MVP (or the Critical slice when IOC-auto-escalated). Top Signature Hits is Suricata-only and does not include ML alerts.
Dashboard -- Recent Alerts feed. Newest ML anomaly alerts flow through the cross-family feed, distinguishable by the ML RCF Anomaly Event type label. Clicking a row opens the same sidebar used on the Hunt page.
**Hunt page -- ** ML RCF Anomaly Event sub-tab. Under the All Alerts bucket, this per-type sub-tab lists every ML anomaly alert. It includes the base alert columns, minus
proto, which is derived from the original event rather than the alert. It also includes the RCF-specific columns:anomaly_score,threshold,suricata_event_type,model_version, and the whitelist columns when present. Analysts sort byanomaly_scoredescending to surface the extreme outliers.Hunt detail sidebar -- standard network section plus any companion protocol section. MVP does not wire a dedicated ML Anomaly sidebar section. Instead, the sidebar renders the Network Base block from the original event five-tuple. It also renders any per-protocol section that corresponds to the anomalous event type. These sections are Suricata DNS, Suricata HTTP, Suricata TLS, Suricata Flow, and Suricata FileInfo. The RCF fields appear inline under the
ml_rcf_anomalyblock on the record. These fields areanomaly_score,threshold,whitelist_action,whitelist_factor,original_score, andmodel_version. The analyst reads the protocol-specific sidebar section to understand what traffic was flagged.
Alert payload example
This is abbreviated JavaScript Object Notation for an ML anomaly alert on a DNS event. The event scored 4.35 against the DNS threshold of 3.0. The underlying event is a standard Suricata DNS record. The alert adds the ml_rcf_anomaly block and the alert_type: "ml_rcf_anomaly" discriminator. A Flow-type alert with whitelist reduction follows. It shows the optional whitelist fields.
A Flow-type alert can have an original score that the whitelist reduced. It carries the three optional whitelist fields alongside the adjusted score:
In the second example, the whitelist reduced a raw score of 40.177 to 24.106. The post-reduction value still crosses the Flow threshold of 20.0, and the alert emits. On an HTTP anomaly, the same block carries suricata_event_type: "http" and threshold: 8.0. It typically carries an original_event.http payload with method, hostname, URL, status code, and length. Analysts read the Suricata HTTP sidebar section for the trigger request metadata.
Tuning considerations
Every RCF tunable is Policy-managed and takes effect without a service restart. The knobs divide into three groups.
Detector capacity and temporal depth.
num_trees(default 20). Number of Random Cut Trees in each detector's forest. More trees stabilize scoring and reduce variance but increase memory and compute per event. Environments with unusually diverse DNS or flow populations may benefit from raising this to 30 or 40; small or highly homogeneous networks can lower it to 10 with minimal accuracy loss.shingle_size(default 3). Size of the sliding window the detector concatenates into each scored point. Larger shingles capture longer temporal patterns at the cost of slower warmup and higher memory per shingle; smaller shingles adapt faster but lose sequence sensitivity. The default balances both.tree_size(default 128). Maximum points stored per tree before first-in-first-out eviction. Controls how much history the model remembers. Raising this slows the model's response to genuine network-behavior changes (a newly-deployed service stays "anomalous" longer); lowering it makes the model more reactive but less stable.
Anomaly sensitivity.
Per-event-type anomaly threshold. Tuned defaults are DNS 3.0, HTTP 8.0, and Flow 20.0. OPSWAT validated these defaults against production-like traffic with the whitelist enabled. They yield a manageable alert volume, roughly 1-2 percent of events. A lower threshold surfaces more anomalies at the cost of false positives. A higher threshold tightens the queue at the cost of missed borderline events. Operators should adjust one threshold at a time. They should observe the resulting queue depth over a warmup window of at least one day.
Whitelist scope.
Whitelist enable. On by default. Disabling the whitelist roughly quadruples alert volume in typical networks because cluster traffic, service discovery, DNS infrastructure, and multicast all score high without whitelist attenuation. Operators who need to validate what the raw model is seeing may temporarily disable the whitelist, but production operation should leave it on.
Whitelist patterns. The whitelist accepts CIDR ranges, port lists, HTTP URL wildcards, and complete-exclusion rules for infrastructure populations the network operator knows are not threat surfaces. Updates propagate through the Policy broadcast so operators do not need to redeploy the RCF service.
A fourth consideration is calibration. Because the RCF detector adapts continuously, alert volume and average score drift as the network evolves. Operators should plan periodic precision reviews. The recommended practice is to sample 50 random alerts monthly. Label each alert as a true positive, a false positive, or a warmup artifact. Adjust thresholds when precision drops below 50 percent or rises above 80 percent (too restrictive). The Updates management surface in Updates Management exposes per-detector threshold state and last-adjusted timestamps. Operators can quickly see where each detector sits.
At a cold start, the model warmup period is the family main false-positive surface. The first few hundred events for each detector score higher than they should while the forest still learns. This dissipates within minutes of live traffic for active event types, DNS and Flow. It dissipates within hours for rarer types, such as HTTP in networks that are mostly TLS. Operators should disregard alerts in the first shingle-size-times-two events. This means six events per detector, in practice almost always within the first minute. Operators should not retune thresholds based on warmup behavior alone.
Related runbook
ML anomaly alerts route through ML Anomaly Investigation. That runbook covers how to read the anomaly score and threshold together. It explains how to interpret whitelist adjustments. It explains how to pivot to the original event protocol-specific sidebar section. It also explains how to correlate concurrent behavioral and enrichment alerts on the same source IP. Finally, it explains how to decide whether a cluster of ML alerts warrants escalation. Alerts on hosts with concurrent Beaconing or Data Exfiltration behavioral detections enter Critical Alert Triage directly. Alerts on flows whose destinations appear in the C2 or InSights feeds also enter Critical Alert Triage directly. This is the IOC auto-escalation case.