
Behavioral detections answer this question: "does this traffic pattern look like something malicious hosts do, even without a known signature or indicator?" Suricata signatures match on packet content. The C2, InSights, and MetaDefender Core families match observed entities against curated intelligence. The behavioral family looks only at traffic shape. It checks how often a client connects back and how much it uploads. It also checks flow duration, port or destination count, DNS query structure, and DNS failure frequency. Eight detections run continuously over the merged event stream. They emit alert payloads when a host or a flow crosses a threshold that no benign production pattern reaches. This chapter describes all eight detections. It explains what each detection looks for. It also explains which conditions raise it, how severity and confidence are assigned, and where analysts find the alert.
First-use acronym expansions in this chapter:
C2 -- command-and-control.
SQL -- Structured Query Language.
IOC -- Indicator of Compromise.
RFC-1918 -- the IETF-reserved private-use IP address ranges
10.0.0.0/8,172.16.0.0/12, and192.168.0.0/16.STDDEV -- standard deviation.
CV -- coefficient of variation, STDDEV divided by mean.
HOP -- hopping window.
TUMBLE -- tumbling window.
DNS -- Domain Name System.
NXDOMAIN -- Non-Existent Domain DNS response.
TLS -- Transport Layer Security.
SNI -- Server Name Indication.
TTL -- Time To Live.
ASN -- Autonomous System Number.
GeoIP -- geographical IP lookup.
DGA -- Domain Generation Algorithm.
MB -- megabyte, 1,048,576 bytes.
Overview
The behavioral detection family runs in a dedicated Streaming SQL engine, RisingWave. It consumes the aggregator merged event stream and applies eight continuous analytics pipelines. Each pipeline is a SQL query over a sliding or tumbling time window. Every new event updates the pipeline state incrementally. Every threshold crossing produces an alert payload on the behavioral alert stream. The alert engine promotes each payload to a typed behavioral alert. It stamps the alert with the unified severity and confidence vocabulary from Detection Overview. Then it publishes the alert to the Hunt page and Dashboard.
Three pipeline properties shape how behavioral detections behave in practice and are worth keeping in mind while reading the per-detection sections below.
Window-based latency. Some detections require a windowed aggregate. Examples include Beaconing four-hour hop, DNS Tunneling one-hour tumble, and DGA one-hour tumble. These detections cannot produce an alert faster than the window boundary. A beacon candidate with fifteen connections in the first fifteen minutes does not fire immediately. It fires only after those connections persist far enough into the window. Long Duration Flow is the only per-flow detection. It fires as soon as the flow crosses its duration threshold.
IOC auto-escalation. Every behavioral detection supports the IOC auto-escalation rule from Detection overview. The rule applies when the detection source, destination, or queried domain coincides with a feed hit. The feed hit can come from the C2 feed, the InSights TIDB (Threat Intelligence Database), or the REPDB (Reputation Database) feed. The alert engine promotes the alert to Critical severity and 0.99 confidence. This happens regardless of the detection own thresholds. The matching C2 Enrichment or InSights Enrichment section shows the match in the Hunt detail sidebar. Analysts can see which feed drove the escalation.
Noise controls at the pipeline level. Every pipeline ships with exclusions. They keep mechanically-periodic protocols out of the candidate set: DNS, DHCP, NTP, and dhcpv6. They also exclude broadcast destinations, multicast destinations, and RFC-1918 internal-to-internal traffic. Analysts cannot tune these exclusions at the alert level. The pipeline SQL contains them because they are too noisy for production alerts.
The sections below present the eight detections in the order used on the Hunt page behavioral sub-tabs.
Beaconing detection
What it is
Beaconing Detection flags periodic client-to-server communication that matches C2 beacon traffic. A compromised host with a remote-access implant phones home on a regular cadence. Examples are every minute, every five minutes, or every hour. It sends a small, consistently sized check-in payload. It receives little or nothing in return until the operator schedules an action. Beaconing Detection looks for that exact shape: many connections, uniform byte sizes, little server response, and activity sustained over hours.
What it detects
Compromised internal hosts with an active remote-access trojan. Cobalt Strike, Sliver, Mythic, Metasploit, and commodity remote-administration-trojan beacon channels that stay resident and keep a control channel open.
Malware in its dormant phase. Implants waiting for an operator task surface as beacon traffic before any data exfiltration or lateral movement is observable.
Legitimate-looking back-channels on encrypted transports. HTTPS, TLS, DNS-over-HTTPS tunneled beacons. The sensor cannot inspect the payload, but flow metadata still shows periodicity.
Custom or bespoke C2 frameworks. The detection is signature-free -- a threat actor's new C2 framework triggers the same way as a commodity one if the periodicity and uniformity are there.
How it works
The pipeline groups flow records by the triple (src_ip, dest_ip, dest_port). It evaluates each group over a four-hour hopping window that slides forward every hour. The pipeline flags a group when it carries at least fifteen connections. The per-flow byte count must have a standard deviation under 1,000 bytes. Also, the server side must send fewer than five times as many packets as the connection count. The pipeline excludes internal-to-internal traffic at the pipeline level. It drops any RFC-1918 destination: 10.0.0.0/8, 192.168.0.0/16, or 172.16.0.0/12. It also drops any broadcast or multicast destination. It drops any flow on the inherently-periodic ports for DNS, DHCP, NTP, and their application-protocol equivalents. Suricata occasionally re-emits a flow with a refined app_proto value as more bytes flow: null -> http -> failed. The pipeline aggregates across all app_proto values for the same tuple. It renders the most specific non-failed protocol in the alert payload.
Trigger conditions
Condition | Threshold | Rationale |
|---|---|---|
Minimum connections |
| Filters low-frequency legitimate traffic. |
Byte-size consistency |
| Beacon check-ins are uniform; normal traffic is not. |
Low server response |
| C2 beacons send more than they receive. |
RFC-1918 destination exclusion | Exclude | Internal-to-internal traffic is never C2 beaconing; the exclusion removed a significant false-positive population during tuning. |
Broadcast / multicast exclusion | Exclude | Broadcast and multicast are not C2 destinations. |
Periodic-protocol exclusion | Exclude ports 53, 67, 68, 123, 5353 and | These protocols are mechanically periodic; their regular timing is expected, not suspicious. |
Group key: src_ip, dest_ip, dest_port. Window: hopping, 4 hours, 1-hour slide.
Severity classification
Severity | Condition |
|---|---|
Critical | IOC match ( |
High | Connections >= 30. |
Medium | Connections >= 20. |
Low | Connections >= 15 (minimum threshold). |
Confidence scoring
Confidence | Condition |
|---|---|
0.99 | IOC match on destination. |
0.95 | Byte |
0.85 | Byte |
0.75 | All other qualifying candidates. |
Where it surfaces
Dashboard -- Recent Severities donut. Contributes to the Critical / High / Medium / Low slices according to the alert's assigned severity. Top Signature Hits is Suricata-only and does not include behavioral alerts.
Dashboard -- Recent Alerts feed. Newest Beaconing alerts flow through the cross-family feed, distinguishable by the
alert_type: beaconinglabel.**Hunt page -- ** Beaconing Detection Alert sub-tab. Under All Alerts, this per-type sub-tab lists every Beaconing alert with the base alert columns (minus
protoandsrc_port, which vary per connection and are not meaningful at the pattern level) plus the Beaconing-specific columns --beacon_score,connection_count,avg_bytes_per_flow,cv_bytes,window_start,window_end.**Hunt detail sidebar -- ** Beaconing Detection section. Rendered on any record that carries a
beaconingblock. Lists connection count, unique flow count, byte / packet averages, byte and packet coefficients of variation, server response ratio, window bounds, and destination country / ASN / organization.
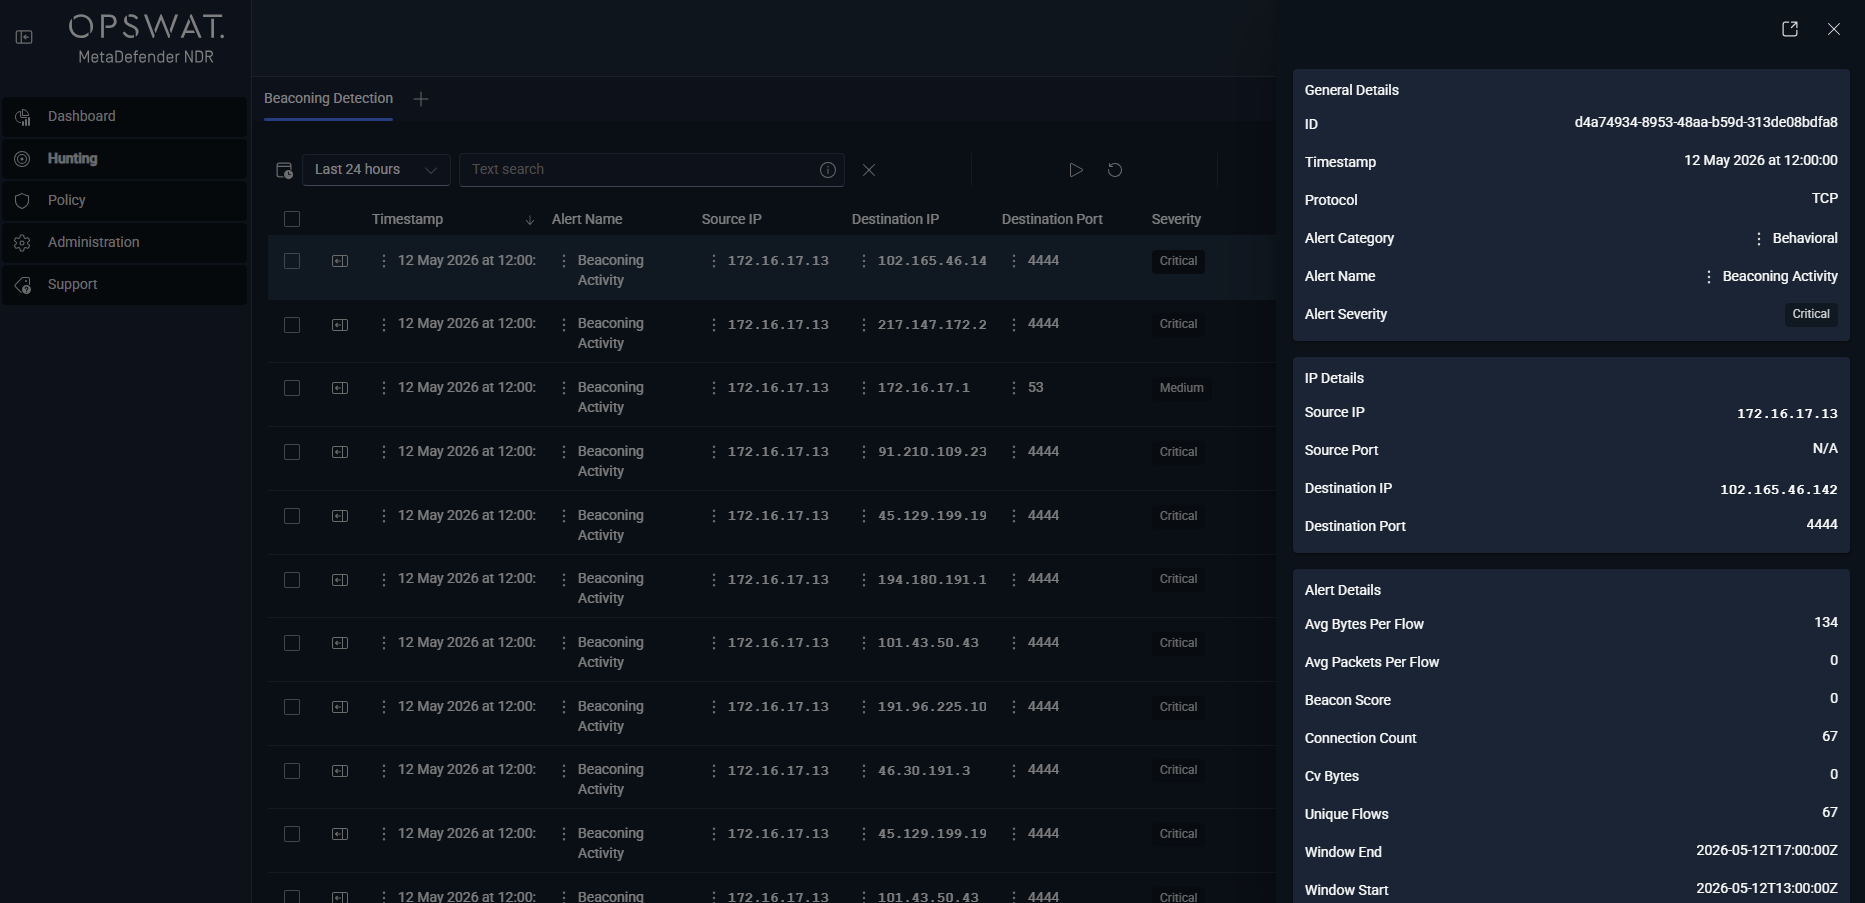
Alert payload example
Tuning considerations
The detection's main false-positive surface is legitimate machine-to-machine traffic with beacon-like shape -- software-update check-ins, metrics telemetry, cloud-agent health pings, and managed-endpoint keepalives. The pipeline-level exclusions (RFC-1918 destinations, broadcast, inherently-periodic protocols) remove the most common cases before evaluation. The remaining false positives are typically internet-bound telemetry to well-known vendors; these concentrate in the Low tier at the minimum connection threshold and resolve cleanly once analysts add the destination ASN or organization to the suppression list. Policy exposes minimum connection count, byte STDDEV threshold, and server-response ratio for per-environment tuning. The defaults in the threshold tables above are intentionally strict. They should remain the start point. If operators loosen them, the false-positive surface grows faster than coverage.
Related runbook
Beaconing alerts route through C2 Beacon Investigation. That runbook covers how to identify the compromised host. It explains how to correlate DNS and TLS sessions on the same source IP. It also explains how to check for concurrent Long Duration Flow or Data Exfiltration signals. Finally, it explains how to pivot to packet capture when the flow protocol is inspectable.
Data exfiltration detection
What it is
Data Exfiltration Detection flags flows where a client uploads much more data than it downloads to an external destination. The shape is distinctive. A browser session downloads far more than it uploads. A backup-agent session alternates. An exfiltration session uploads disproportionately more than it receives. The detection measures the upload-to-download byte ratio on each flow. It raises an alert when the ratio and the absolute upload volume both cross their thresholds.
What it detects
Bulk data theft over approved encrypted transports. HTTPS, TLS, custom TCP uploads -- the payload is opaque but the byte-direction ratio is not.
Staging-server exfiltration. Compromised internal host uploading to an attacker-controlled dropbox, public paste site, cloud-storage bucket, or file-sharing service.
Covert exfiltration channels. The detection covers DNS, ICMP, and application-layer covert channels indirectly. Any tunneled upload with enough volume crosses the byte threshold.
Insider data movement. Large outbound uploads from workstations or servers that were never expected to send traffic outbound.
The detection does not distinguish malicious exfiltration from a legitimate large backup upload by itself. Data Exfiltration plus a C2 or InSights enrichment on the destination is a much stronger signal. Thus, the IOC auto-escalation rule elevates such events to Critical.
How it works
The pipeline groups flow records by the quad (src_ip, dest_ip, dest_port, app_proto). It evaluates each group over a 15-minute hopping window with a 5-minute slide. The pipeline flags a group when the sum of bytes_toserver is at least twice the sum of bytes_toclient. Here, bytes_toserver means client upload and bytes_toclient means server download. The absolute upload volume must also be at least 1 MB. Two directional boundaries further restrict the candidate set. The source must be inside an RFC-1918 range. Thus, internal-file-transfer-to-internal-file-server patterns do not score as exfiltration. The destination must be outside all RFC-1918 ranges. Thus, exfiltration must cross the network boundary. If the server sends zero bytes but the client sends data, the payload caps the ratio at 999.99.
Trigger conditions
Condition | Threshold | Rationale |
|---|---|---|
Minimum upload ratio |
| Client sends at least twice what it receives. |
Minimum upload volume |
| Eliminates low-volume noise. |
Internal source requirement |
| Prevents CDN downloads and cloud-service push traffic from scoring. |
External destination requirement |
| Exfiltration must cross the network boundary. |
Group key: src_ip, dest_ip, dest_port, app_proto. Window: hopping, 15 minutes, 5-minute slide.
Severity classification
Severity | Condition |
|---|---|
Critical | IOC match OR (ratio >= 10:1 AND upload >= 100 MB). |
High | (Ratio >= 5:1 AND upload >= 10 MB) OR (ratio >= 2:1 AND upload >= 100 MB). |
Medium | Ratio >= 2:1 AND upload >= 10 MB. |
Low | Meets minimum threshold (ratio >= 2:1 AND upload >= 1 MB). |
Confidence scoring
Confidence | Condition |
|---|---|
0.99 | IOC match. |
0.95 | Ratio >= 10:1 AND upload >= 100 MB. |
0.85 | Ratio >= 5:1 AND upload >= 10 MB. |
0.80 | Ratio >= 2:1 AND upload >= 100 MB. |
0.70 | All other qualifying candidates. |
Where it surfaces
Dashboard -- Recent Severities donut and Recent Alerts feed with
alert_type: data_exfiltration.**Hunt page -- ** Data Exfiltration Detection Alert sub-tab. Base alert columns minus
protoplus the Data-Exfiltration-specific columns --upload_ratio,upload_mb,download_mb,flow_count,total_upload_bytes,total_download_bytes.**Hunt detail sidebar -- ** Data Exfiltration Detection section. Lists flow count, unique flow count, total upload / download in megabytes, upload ratio, IOC status, destination country / ASN / organization.
Alert payload example
Tuning considerations
The 15-minute window is short enough to fire on a single exfiltration burst and long enough to average over typical session jitter. The 1 MB minimum upload floor is conservative; environments with high-volume legitimate uploads (development teams pushing large artifacts, media organizations publishing video, scientific workloads uploading datasets) may see the Low tier fire on benign traffic. The correct tuning is to add specific destinations to the Policy exfiltration allowlist. Examples include internal-to-cloud storage and approved source-code repositories. Do not raise the floor globally. An attacker who conducts low-and-slow exfiltration will stay under a raised floor. The same attacker will still hit a scoped allowlist.
Related runbook
Data Exfiltration alerts route through Data Exfiltration Investigation.
Long duration flow detection
What it is
Long Duration Flow Detection flags individual flows whose elapsed wall-clock duration exceeds an hour. Persistent connections that stay open across session boundaries are characteristic of C2 control channels. They are also characteristic of reverse tunnels, VPN (Virtual Private Network) tunnels through a monitored boundary, and long-running interactive sessions. All can be legitimate. But in a security context, analysts must triage all of them.
What it detects
Persistent C2 control channels. A reverse shell or a long-poll beacon whose socket stays open for the operator's convenience.
SSH (Secure Shell) tunnels, reverse-SSH port forwards, and VPN-over-TLS tunnels that stay connected for the duration of an interactive session or longer.
Database replication, application heartbeats, and managed-service control planes that hold a long-lived connection. These are frequent false positives and should be suppressed per-source or per-destination once identified.
Compromised IoT (Internet of Things) devices with a persistent outbound socket to a command server.
How it works
The pipeline evaluates each flow record individually when the flow.age field crosses 3,600 seconds. The flow.age field is the Suricata-reported duration in seconds. This per-event detection does not use a sliding or tumbling window. It fires as soon as the threshold is crossed. The alert re-emits at later thresholds: 10 hours, 20 hours, and 24 hours. Thus, analysts who track a long-running session can see severity escalate without loss of the original alert.
Trigger conditions
Condition | Threshold | Rationale |
|---|---|---|
Minimum duration |
| Below this, most persistent sessions are benign (web sockets, streaming media). |
Flow is still active or newly observed | Yes | Historical backfill is not in scope. |
Group key: per-flow. Window: none (per-event).
Severity classification
Severity | Alert Level | Duration |
|---|---|---|
Critical | RED | IOC match OR >= 86,400 s (24 hours). |
High | ORANGE |
|
Medium | YELLOW |
|
Confidence scoring
Confidence | Duration |
|---|---|
0.99 | IOC match. |
0.95 |
|
0.90 |
|
0.80 |
|
0.60 |
|
0.40 |
|
Where it surfaces
Dashboard -- Recent Severities donut and Recent Alerts feed with
alert_type: long_duration.**Hunt page -- ** Long Duration Flow Alert sub-tab. Base alert columns minus
protoplus --duration_seconds,duration_hours,total_bytes,bytes_per_second,alert_level(RED / ORANGE / YELLOW).**Hunt detail sidebar -- ** Long Duration Flow section. Lists
flow_id, duration in seconds and hours, total bytes and packets, bytes-per-second, IOC status, destination country / ASN / organization.
Alert payload example
Tuning considerations
The three-level alert scheme (YELLOW -> ORANGE -> RED) keeps analysts informed as a session ages. It does not create alert fatigue. A session that opens at T+0 emits Medium at one hour. Then it emits High at ten hours. Then it emits Critical at twenty-four hours. The primary false-positive population is operational. It includes managed-service control planes, cloud-agent persistent connections, database replication sessions, and administrative SSH sessions. If an alert destination is benign, Policy supports suppression by source-destination pair. Thus, analysts do not have to triage the same alert again on every re-trigger. OPSWAT does not recommend per-environment tuning for duration thresholds and alert-level mapping.
Related runbook
Long Duration Flow alerts route through C2 Beacon Investigation when they coincide with a suspicious destination. Duration-only alerts route through Alert, Flow, and PCAP Pivoting when they need context before classification.
Port scanning detection
What it is
Port Scanning Detection flags vertical scans: one source IP touches many different ports on one destination IP. The shape is clear. A TCP or UDP probe touches port 22, then 23, then 25, then 80, then 443, and so on. It does this across a port range from the same source to the same destination, usually in a short time window. The detection counts distinct destination ports per source-destination pair over a one-hour window. It raises an alert when the count crosses the threshold.
What it detects
Reconnaissance against a specific host. An attacker probes a newly-identified target for open services before attack vector selection.
Service-discovery steps inside an established intrusion. Internal pivot after initial access -- the attacker enumerates the local network one host at a time.
Vulnerability-scanner traffic from an unauthorized source. Authorized scanners should be excluded via Policy.
How it works
The pipeline groups flow records by the pair (src_ip, dest_ip). It counts DISTINCT dest_port per group over a one-hour hopping window with a 15-minute slide. The pipeline flags a group when the distinct-port count reaches 10. The detection does not distinguish scan type, such as SYN, connect, or UDP probe. The signal comes from port variety, not scan technique. Any method that touches enough distinct ports produces the same alert.
Trigger conditions
Condition | Threshold | Rationale |
|---|---|---|
Unique destination ports per src->dest pair |
| Minimum to distinguish scanning from normal multi-service access. |
Group key: src_ip, dest_ip. Window: hopping, 1 hour, 15-minute slide.
Severity classification
Severity | Condition |
|---|---|
Critical | IOC match OR >= 100 ports. |
High |
|
Medium |
|
Low |
|
Confidence scoring
Confidence | Unique POrts |
|---|---|
0.99 | IOC match. |
0.95 |
|
0.85 |
|
0.75 |
|
0.65 |
|
Where it surfaces
Dashboard -- Recent Severities donut and Recent Alerts feed with
alert_type: port_scan.**Hunt page -- ** Port Scan Detection Alert sub-tab. Base alert columns minus
protoplus --unique_ports_scanned,total_connections,protocols_used,first_seen,last_seen.**Hunt detail sidebar -- ** Port Scan Detection section. Lists unique port count, total connection count, protocol list, window bounds, IOC status, destination country / ASN / organization.
Alert payload example
Tuning considerations
Authorized vulnerability scanners are the dominant false-positive population. These scanners can be internal or vendor-operated. Add the scanner source IPs or the scanner CIDR range to a Policy suppression list. Then the pipeline skips them entirely instead of alert generation and dismissal. Port-scan alerts from unexpected internal sources are high-value signals. Port scanning from a workstation is almost never legitimate.
Related runbook
Port Scan alerts have no dedicated runbook at MVP. Analysts triage them through Critical Alert Triage when they are Critical or High. Otherwise, analysts use Alert, Flow, and PCAP Pivoting.
Connection spray detection
What it is
Connection Spray Detection flags horizontal scans: one source IP touches many destination IPs in a short window. Port Scanning enumerates services on one host. Connection Spray enumerates hosts across the network. The shape appears in worm-style lateral propagation. It also appears in brute-force credential spray against many targets and post-breach reconnaissance across a subnet.
What it detects
Worm and ransomware-precursor lateral movement. An infected host probes for a Server Message Block, Remote Desktop Protocol, or exposed-service neighbor to spread to.
Credential spraying. One source tries the same username / password pair against many hosts.
Recon sweeps. Post-access reconnaissance walks a subnet to find high-value targets.
How it works
The pipeline groups flow records by src_ip. It counts DISTINCT dest_ip per source over a one-hour hopping window with a 15-minute slide. The pipeline flags a group when the distinct-destination count reaches 20.
Trigger conditions
Condition | Threshold | Rationale |
|---|---|---|
Unique destination IPs per source |
| Minimum to distinguish spray behavior from normal browsing / application traffic. |
Group key: src_ip. Window: hopping, 1 hour, 15-minute slide.
Severity classification
Severity | Condition |
|---|---|
Critical | IOC match OR >= 200 destinations. |
High |
|
Medium |
|
Low |
|
Confidence scoring
Confidence | Unique destinations |
|---|---|
0.99 | IOC match. |
0.95 |
|
0.85 |
|
0.75 |
|
0.65 |
|
Where it surfaces
Dashboard -- Recent Severities donut and Recent Alerts feed with
alert_type: connection_spray.**Hunt page -- ** Connection Spray Detection Alert sub-tab. Base alert columns minus
protoplus --unique_destinations,total_connections,unique_ports,first_seen,last_seen.**Hunt detail sidebar -- ** Connection Spray Detection section. Lists unique destination count, total connection count, unique port count, window bounds, IOC status.
Alert payload example
Tuning considerations
Backup clients, DNS recursive resolvers that talk to authoritative servers, and monitoring / observability agents are the most common false positives. These agents poll many targets. As with Port Scanning, use a source-IP suppression list on the operational hosts. Do not tune the threshold. An attacker that stays under a raised threshold is still a problem.
Related runbook
Connection Spray alerts triage through Critical Alert Triage when they are Critical or High. The runbook covers how to correlate spray with destination alert patterns. It also explains how to identify the source. Finally, it explains how to determine whether the source is authorized for scan behavior.
DNS Tunneling detection
What it is
DNS Tunneling Detection flags DNS queries whose shape indicates DNS use as a covert data channel. Tunneling tools encode payload bytes into subdomain labels of attacker-controlled domains. Examples include iodine, dnscat2, DNScat, and custom C2. Legitimate DNS traffic rarely has long, high-entropy, deeply-nested query names. The detection scores each individual query against five indicators. It also aggregates queries by parent domain each hour. This identifies the parent domain that drives the activity.
What it detects
Active DNS tunnels. Exfiltration over DNS, interactive C2 over DNS, file transfer over DNS -- encoded in subdomain labels of an attacker-controlled domain.
DNS amplification artifacts. Large TXT or NULL response payloads that look like tunneled responses.
High-entropy subdomain enumeration. Bulk queries to varied subdomains of a single parent domain (a common fingerprint of a DNS-based covert channel).
How it works
The pipeline operates in two modes: per-query suspicion score and hourly parent-domain aggregation. For each query, the pipeline scores each DNS query event (event_type = 'dns' AND dns.type = 'query') against five binary indicators. The indicators are long query name, many subdomains, unusual record type, large response, and long first-subdomain label. Each satisfied indicator adds one to a suspicion_score (0-4). Any score of at least 1 produces a per-query alert. Each hour, the pipeline groups queries by parent domain over a one-hour tumbling window. The aggregate carries total queries, unique subdomains, unique sources, and counts of each suspicious-indicator class. This lets analysts see the parent domain that drives alert volume.
Trigger conditions
Per-query indicators:
Indicator | Condition | Score |
|---|---|---|
Long query name |
| +1 |
Many subdomains | Subdomain count > 3 levels | +1 |
Unusual record type |
| +1 |
Large response |
| +1 |
Encoded label | First subdomain label > 25 chars | +1 |
A per-query alert raises when any indicator is satisfied (suspicion_score >= 1). Input filter: event_type = 'dns' AND dns.type = 'query'.
The pipeline computes hourly parent-domain aggregation (dns_tunneling_hourly) per parent domain per hour. It carries total_queries, unique_subdomains, unique_sources, long_query_count, many_subdomain_count, unusual_type_count, large_response_count, has_high_unique_ratio (unique_queries / total_queries > 0.8), and has_high_query_rate (total_queries > 100). Only parent domains with more than 5 queries per hour are output.
Severity classification (per-query)
Serverity | Condition |
|---|---|
Critical | IOC match on query domain. |
High | Suspicion score >= 3. |
Medium | Suspicion score = 2. |
Low | Suspicion score = 1. |
Confidence scoring (per-query)
Confidence | Condition |
|---|---|
0.99 | IOC match. |
0.85 | Suspicion score >= 3. |
0.70 | Suspicion score = 2. |
0.50 | Suspicion score = 1. |
Where it surfaces
Dashboard -- Recent Severities donut and Recent Alerts feed with
alert_type: dns_tunneling.**Hunt page -- ** DNS Tunneling Suspicious Alert sub-tab. Base alert columns minus
protoplus --query_name,record_type,query_length,subdomain_count,suspicion_score, and the per-indicator boolean flags.**Hunt detail sidebar -- ** DNS Tunneling Suspicious section. Lists the full query name, first subdomain, record type, query and answer length, suspicion score, the per-indicator booleans, and IOC status.
Alert payload example
Tuning considerations
The per-query indicators are deliberately generous. They catch weak signals and surface them at the Low tier for analyst review. In production, the largest false-positive source is cloud-service and anti-malware telemetry. This telemetry encodes state into subdomain labels. Examples include some anti-virus cloud-lookup services, cache-busting content-delivery hostnames, and analytics services. The dns_tunneling_hourly aggregate is the pivot point for suppression. Analysts identify the parent domain that drives false positives and add the parent to a Policy allowlist. This removes the entire query family from the detection without changes to per-query thresholds. Policy exposes the five per-query thresholds, but the defaults should stay in place. If operators tighten them, they risk missed sophisticated tunnels that stay just under the raised threshold.
Related runbook
DNS Tunneling alerts route through Tunneling Investigation. That runbook covers how to pivot from the flagged query to the full query stream for the source and parent domain. It explains how to cross-reference with C2 and InSights enrichments. It also explains how to determine whether the host needs isolation.
DGA detection
What it is
DGA Detection flags hosts that query large numbers of algorithmically-generated domain names. This is a hallmark of DGA-based malware. DGA families generate hundreds of random-looking domains per day and query them in bulk. They expect most to fail with NXDOMAIN until one resolves to the attacker current C2 server. The resulting DNS traffic has a distinctive shape. It has high query volume, high NXDOMAIN ratio, and high unique-domain variety, all from one source.
What it detects
DGA-based commodity malware families. Conficker, Locky, CryptoLocker lineage, Qakbot, Emotet phases that use DGA domains as a fallback to hard-coded C2.
DGA-enabled loaders and persistence implants that use a generated domain as the rendezvous point.
Algorithmic domain-resolution libraries in advanced implants that generate candidate domains per day or per hour.
How it works
The pipeline groups DNS events by src_ip over a one-hour tumbling window. It computes the NXDOMAIN ratio and total query count per source. The NXDOMAIN ratio is the fraction of queries whose response was NXDOMAIN. The pipeline flags a source when the NXDOMAIN ratio is at least 0.5 and the total query count is at least 20. It also flags a source when any queried domain matches an IOC. The combined threshold distinguishes DGA behavior from benign typos or misconfigurations. A host that types a few invalid domains has a high NXDOMAIN ratio but low volume. A host with high DNS volume on valid domains has low NXDOMAIN ratio.
Trigger conditions
Condition | Threshold | Rationale |
|---|---|---|
NXDOMAIN ratio |
| Legitimate DNS has very low NXDOMAIN rates; DGA produces mostly failures. |
Minimum queries |
| Filters out hosts that simply mistyped a domain. |
Combined | ratio >= 0.5 AND queries >= 20, OR IOC match | Both conditions must be true unless a known-malicious domain was queried. |
Group key: src_ip. Window: tumbling, 1 hour.
Severity classification
Severity | Condition |
|---|---|
Critical | IOC match. |
High | NXDOMAIN ratio >= 0.7 AND total queries >= 50. |
Medium | NXDOMAIN ratio >= 0.5 AND total queries >= 20. |
Low | All others above threshold. |
Confidence scoring
Confidence | Condition |
|---|---|
0.99 | IOC match. |
0.85 | NXDOMAIN ratio >= 0.7 AND total queries >= 50. |
0.70 | NXDOMAIN ratio >= 0.5 AND total queries >= 20. |
0.50 | Above minimum threshold.0.99 |
Where it surfaces
Dashboard -- Recent Severities donut and Recent Alerts feed with
alert_type: dga.**Hunt page -- ** DGA Detection Alert sub-tab. Base alert columns minus
protoplus --nxdomain_ratio,unique_domains,total_queries.**Hunt detail sidebar -- ** DGA Detection section. Lists NXDOMAIN ratio, unique domain count, total query count, and IOC status.
Alert payload example
Tuning considerations
Misconfigured applications that query dead hostnames repeatedly -- legacy DNS clients, failed service-discovery loops, stale-configuration agents -- will raise DGA alerts at the Low and Medium tiers. The remedy is the same as with the other detections. Add the offending source IP to a Policy suppression list after identification. Do not raise the NXDOMAIN ratio or query thresholds globally. The unique-domain variety field (unique_domains) is the strongest corroborating signal. A real DGA shows fifty or more distinct domains per hour. A misconfigured client typically fails the same small group of names.
Related runbook
DGA alerts triage through C2 Beacon Investigation. DGA activity is the pre-Beaconing rendezvous step for a DGA-enabled implant. Analysts correlate DGA alerts with Beaconing and C2 Infrastructure alerts. This helps locate the implant and its C2 destination.
Fast Flux detection
What it is
Fast Flux Detection flags DNS domains that resolve to many different IP addresses over a short period and with very short TTLs. This fast-flux hosting pattern hides C2 servers, phishing landing pages, and malicious content behind compromised hosts. The hosts act as reverse-proxy front ends and rotate rapidly. The detection distinguishes fast flux from legitimate large-scale content delivery by combining unique-IP count with TTL value. A content-delivery network has many IPs but long TTLs. Fast flux has many IPs and very short TTLs.
What it detects
Fast-flux C2 hosting. A control domain resolves to a different compromised proxy every few minutes.
Phishing and credential-harvester infrastructure hosted on fast-flux botnets.
Exploit-kit landing pages that rotate IPs to evade block lists.
How it works
The pipeline consumes DNS response events, which are A or AAAA records with non-null rdata. It groups them by the queried domain over a one-hour tumbling window. The pipeline flags a domain when the window carries at least 5 unique response IPs. The average TTL across the responses must be under 600 seconds. The pipeline also flags a domain when any response matches an IOC.
Trigger conditions
Condition | Threshold | Rationale |
|---|---|---|
Unique response IPs per domain |
| Legitimate domains rarely resolve to more than three or four IPs in an hour. |
Average TTL | < 600 seconds | Fast-flux operators rotate IPs quickly; legitimate content-delivery networks use 300-3,600 s TTLs. |
Combined | unique IPs >= 5 AND avg TTL < 600, OR IOC match | Both conditions must be true unless a known-malicious IP or domain was observed. |
Group key: domain (query name). Window: tumbling, 1 hour. Input: DNS responses for A / AAAA records with non-null rdata.
Severity classification
severity | Condition |
|---|---|
Critical | IOC match. |
High | Unique IPs >= 10 AND avg TTL < 300. |
Medium | Unique IPs >= 5 AND avg TTL < 600. |
Low | All others above threshold. |
Confidence scoring
Confidence | Condition |
|---|---|
0.99 | IOC match. |
0.85 | Unique IPs >= 10 AND avg TTL < 300. |
0.70 | Unique IPs >= 5 AND avg TTL < 600. |
0.50 | Above minimum threshold. |
Where it surfaces
Dashboard -- Recent Severities donut and Recent Alerts feed with
alert_type: fast_flux.**Hunt page -- ** Fast Flux Detection Alert sub-tab. Base alert columns minus
protoplus --domain,unique_ips,avg_ttl,min_ttl,max_ttl,unique_requestors.**Hunt detail sidebar -- ** Fast Flux Detection section. Lists the domain, unique IP count, TTL statistics, unique requestor count, and IOC status.
Alert payload example
Tuning considerations
Large global content-delivery networks occasionally satisfy the fast-flux condition on new properties whose TTLs are tuned aggressively for cache-invalidation reasons. The detection intentionally does not carve out content-delivery-network ASN ranges. That would give an attacker a cheap evasion path: host the flux front end inside a popular network. When a content-delivery network domain triggers repeatedly with no other corroborating signal, use a per-domain Policy allowlist. Do not loosen the unique-IP or TTL thresholds.
Related runbook
Fast Flux alerts triage through C2 Beacon Investigation. That runbook covers how to resolve the flagged domain current IP set. It explains how to cross-reference with C2 / InSights enrichments on the resolved IPs. It also explains how to identify the internal hosts that queried the domain. Finally, it explains how to determine whether any host also shows Beaconing or Long Duration Flow activity against one rotating IP.