
Overview
The Hunt page answers this question: "what happened, who did it, and where else did it show up?"
Operators reach the page from the left navigation rail (Hunting). Operators also use the Dashboard Recent Alerts row action. That action mounts the Hunt drill-down sidebar in place.
The page has three concepts:
Event buckets -- the top-level groupings into which every event falls. MetaDefender NDR exposes five: All Events, All Alerts, Network Sessions, Netflows, and Files.
Tabs -- a persistent workspace of open investigation views. Each tab is a saved query against a specific bucket and detection type with its own time range, filters, and selection state.
Detail sidebar -- the collapsible pane that opens when an operator selects a row. It shows a full type-specific event view with enrichments and correlations.
A single Hunt session typically has several open tabs. Examples include an All Alerts tab, a Sessions -> DNS tab, and a Files tab. One or more drill-down tabs can also open from right-click pivots. Tabs persist across sessions. If the operator closes the browser and returns, the workspace stays intact.
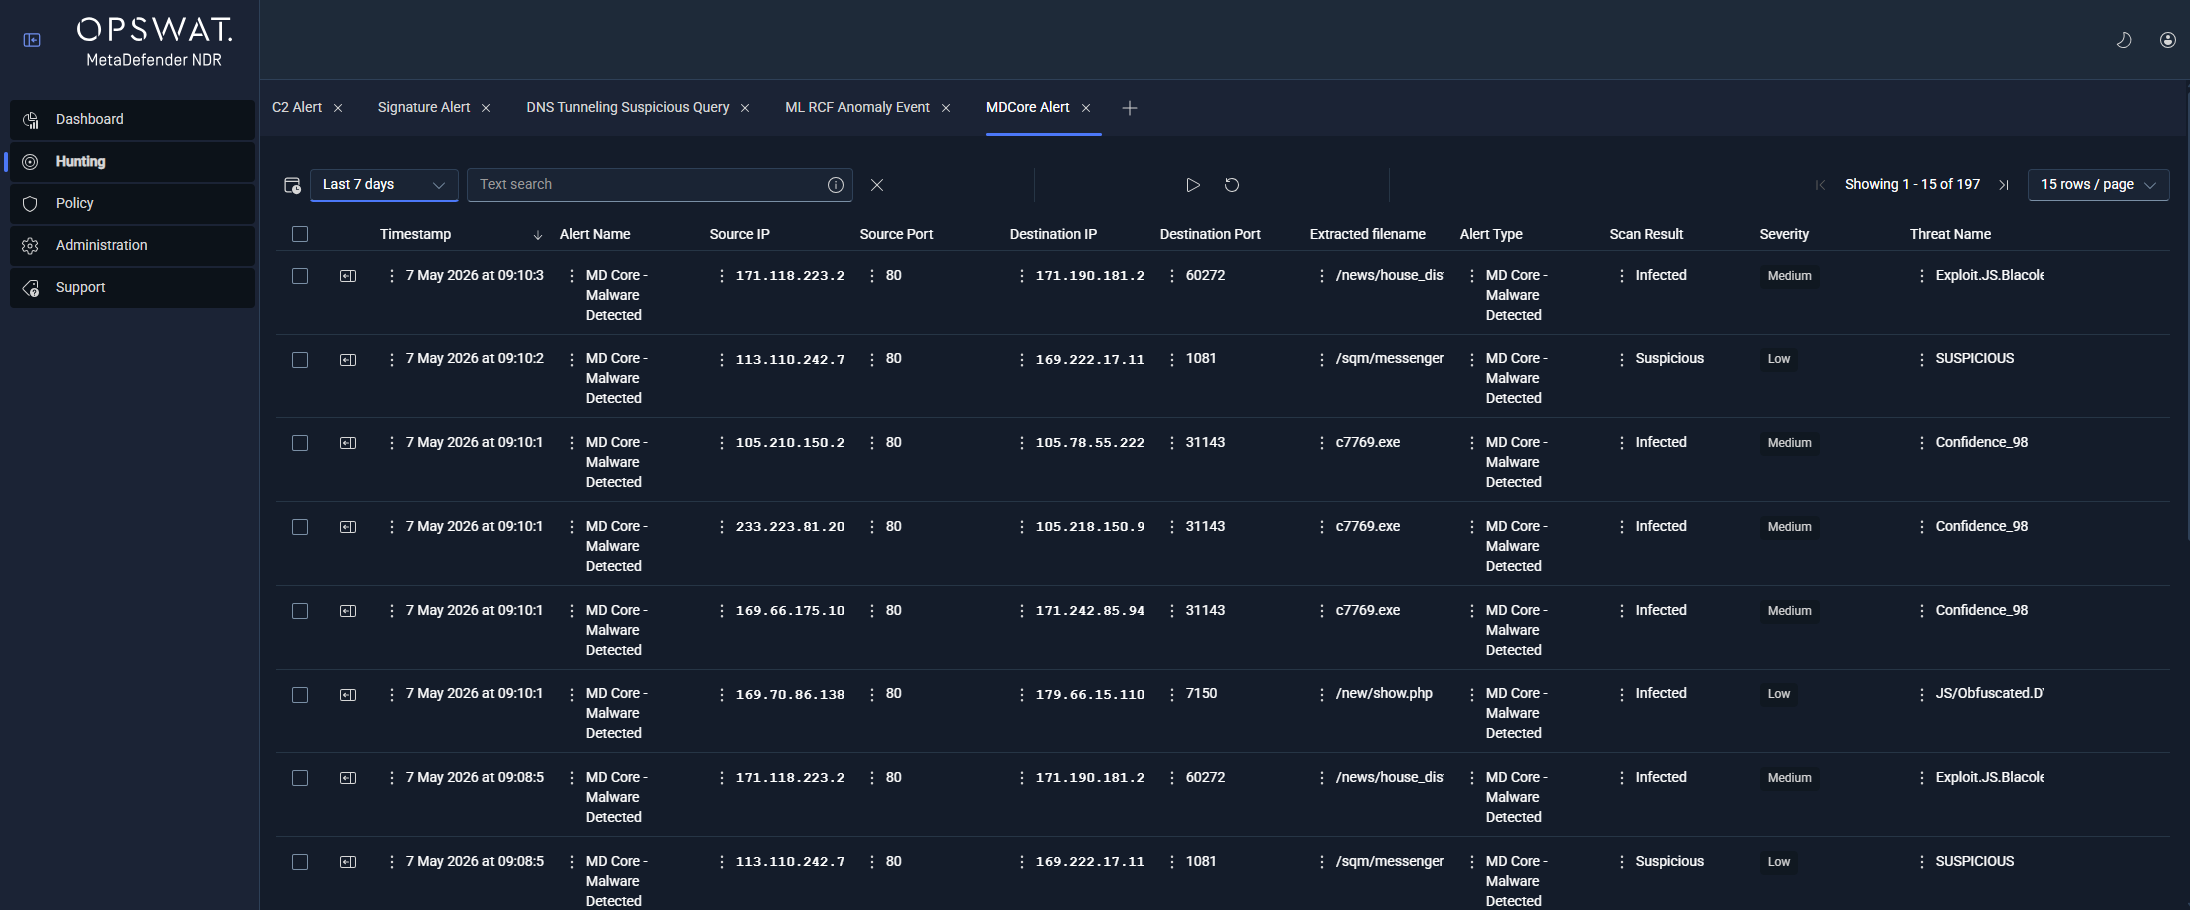
Tabs and tab lifecycle
Tabs organize the Hunt page. Each tab is a self-contained investigation context: its own query, time window, sort, pagination, and selected row.
Creating a tab
Operators create a tab when they select an entry from the Hunt page menu. The menu uses buckets. Select Alerts -> All Alerts to open a new All Alerts tab. Select Sessions -> DNS to open a new DNS session tab. The new tab opens next to the active tab. The new tab becomes the focused workspace.
Several drill-down actions also create tabs:
Select the Recent Alerts row action on the Dashboard. The matching Hunt tab opens and mounts the sidebar on that row.
A right-click pivot from a row value opens a new tab. The new tab uses the pivoted value as a pre-filter. See Right-Click Context Menus on Values below.
A cross-tab pivot from the sidebar opens the matching flow, session, or file tab in a new position. See Pivoting Between Tabs below.
Closing, reordering, and re-opening tabs
Tabs show a close control on their header. If the operator closes the last tab, the Hunt surface becomes empty. The menu stays ready for a new selection. The operator can drag tabs into a new order. The workspace saves the order.
The operator cannot recover a closed tab as a tab. Close actions are destructive. The same menu entry always creates an equivalent blank tab for the same detection type.
Persistence across sessions
The full tab workspace persists per user. For each tab, the workspace keeps the bucket, detection type, applied time range, and quick-search text. It also keeps column width, column order, pagination, and the selected row, if one exists. If the operator signs out and back in, the Hunt page restores the workspace.
MetaDefender NDR scopes user-level persistence by event bucket. Thus, column preferences for DNS session tabs do not interfere with column preferences on Network Session tabs.
Tab types
Each tab starts from one of five event buckets. Select a bucket with no sub-type to open a unified view. Select a sub-type to open a type-specific tab. That tab has the column projection and sidebar renderer for that type.
All events
The widest view. All Events returns every event regardless of type -- alerts, sessions, flows, and files -- with the minimum common column set (timestamp, protocol, source and destination endpoints). Operators use it as a triage starting point when they do not yet know what kind of event triggered the behavior they are hunting.
All alerts (alert pipeline)
All Alerts returns every record that reached the alert pipeline. This includes Suricata signature alerts, C2 alerts, Threat Intelligence (InSights) alerts, MetaDefender Core alerts, behavioral detections, and ML anomaly alerts. The common column set is timestamp, protocol, source and destination endpoints, alert type, and severity.
Per-type sub-tabs narrow All Alerts to a single detection family:
Every alert sub-tab exposes severity (Critical, High, Medium, Low) as a first-class column and supports the same right-click pivots described below.
Sub-tab | What it Contains |
|---|---|
SignatureAlert | Classic intrusion-detection signature hits from Suricata with signature message, identifier (SID), category, MITRE technique and tactic, and payload. |
C2 Infrastructure Alert | Matches against command-and-control (C2) IP and domain threat intelligence, with match type, matched value, score, confidence, and source feed. |
InSights Alert | Matches against OPSWAT InSights Threat Intelligence Database (TIDB) and Reputation Database (REPDB), with the matched entity and source tagging. |
MDCore Alert | MetaDefender Core file-scan verdicts: scan result, threat name, detection engine coverage, and file metadata. |
Behavioral detections (one sub-tab per type) | Beaconing, Data Exfiltration, Long Duration, DNS Tunneling, DGA, Fast Flux, Port Scan, Connection Spray, and the Composite / Unified aggregates. See Behavioral detections for the full catalog. |
ML Random Cut Forest Anomaly | Anomaly detections from the RCF model, carrying the anomaly score, the threshold the score crossed, the model version, and the underlying event that scored. |
Network sessions
Network Sessions returns per-protocol session records -- one row per protocol transaction -- in a unified table. Per-protocol sub-tabs apply a projection specific to each protocol parser:
Sub-tab | Protocol-specific fields |
|---|---|
DNS | Query name, record type, response code, TTL, answer data. |
HTTP | Hostname, URL, method, status, user agent, referer, content-type, response length |
TLS | Version, SNI, certificate subject and issuer, validity window, JA3 / JA3S / JA4 fingerprints, cipher, session resumption flag. |
QUIC | Version, SNI, JA3 / JA4 fingerprints, client / server Application-Layer Protocol Negotiation (ALPN). |
SSH | Protocol version, client and server software, HASSH client and server fingerprints, key-exchange and cipher algorithms. |
SMB | Command, filename, share, access flags, status. |
RDP | Client name, client build, cookie, keyboard layout, X.509 certificate subject and issuer. |
SMTP | Mail-from, recipients, HELO, attachment filenames, reply codes. |
FTP | Command, command data, reply code. |
FileInfo | Filename, magic string, SHA-256, Message Digest 5 (MD5), size, state, stored flag. See Files below. |
Every session row carries the standard 5-tuple: source IP and port, destination IP and port, and protocol. It also carries a community_id correlator. The correlator joins all events that belong to the same connection. If the sensor and enrichment pipeline attach intelligence to a row entity, the relevant enrichment ribbon appears inline. For example, the row can show a TIDB match on the DNS query name. The sidebar shows the full enrichment payload.
Operational Technology (OT) protocol event types are on the roadmap. These types are Modbus, DNP3, Ethernet/Internet Protocol (ENIP) / Common Industrial Protocol (CIP), S7comm, Building Automation and Control Networks (BACnet), and IEC 60870-5-104 (IEC104). When OPSWAT ships them, they appear as additional Network Sessions sub-tabs.
Netflows
Netflows returns NetFlow and connection-summary records -- one row per flow, emitted after flow timeout or protocol-parser close. Columns include packets and bytes per direction, to-server and to-client. They also include flow start, end, age, state, termination reason, alerted flag, transaction count, and exception policy.
Netflows is the primary surface for packet-volume and byte-volume investigations. Operators use it to find which internal host uploaded 2 gigabytes to which external IP. Operators also use it to find the time window, open long-duration connections, and abnormal terminations.
Files
Files returns FileInfo events -- one row per file the sensor extracted from observed traffic. Columns include filename, magic string, SHA-256, MD5, file size, state (CLOSED when the file is eligible for MetaDefender Core enrichment), and stored flag.
If the Manager enables MetaDefender Core enrichment and scans the file, the row also carries the scan result and threat name. A right-click pivot on the SHA-256 column opens an All Events tab. The tab shows every event that referenced the same file hash, such as HTTP download, SMB write, or SMTP attachment. The analyst can trace the file path across the network.
Search and filtering
The top bar of every Hunt tab shows three controls. These controls govern what the table returns: quick search, the time selector, and the advanced-search query builder.
Quick search
Quick search is a single text box in the top bar that applies a free-text search across the event's key indexed fields. Operators use it for fast entity lookups -- a suspected malicious domain, a specific IP, a SHA-256 hash, a signature name -- without opening the advanced builder.
Quick search covers an intentionally narrow field set. This keeps the query fast on high-volume deployments. If operators must match a field outside that set, they use the advanced search builder.
Time selection
Time selection is a dual-mode control. It combines a relative picker, for example Last 15 minutes, Last 1 hour, Last 24 hours, or Last 7 days. It also combines a calendar range picker, for example June 12 09:00-June 12 17:00. Operators toggle between the two modes without loss of the in-progress selection.
The selected time range applies to every query from the tab. The tab persists the selected time range. Very wide ranges increase query latency. Examples are Last 7 days, Last 30 days, and custom multi-week ranges. Operators narrow the range when they need fast iteration. Operators widen the range only to confirm long-tail behavior.
Advanced search
Advanced search is a visual query builder in the top bar. It supports the full Boolean grammar: AND, OR, and NOT. It combines that grammar with field-specific filters. The filters project the correct operator for each field type. Examples include equality for categorical fields, prefix for hostnames, range for numeric fields, and set membership for enumerations. Operators can nest expressions to build complex conditions.
The tab holds the advanced-search payload. If the operator switches tabs, the builder state does not clear. If the operator returns to the tab later, MetaDefender NDR restores the last-applied expression. Saved named searches are not part of MVP. Operators recreate complex queries when they open them again from the tab workspace.
Faceting and column filtering
Column filters on the results table are on the roadmap. These filters are per-column filter inputs in the table header. On MVP, operators narrow results with the advanced search query. Operators can also pivot from a row value in the existing result set.
Real-time mode
Every tab has a real-time mode that continuously refreshes the result set as new events land in storage. In real-time mode, the table repolls at a short cadence. New rows appear at the top. Under normal conditions, end-to-end latency from sensor observation to the Hunt table is under ten seconds.
Operators use a toggle in the top bar to switch a tab between real-time mode and historical mode. Historical mode runs one query against the selected time range. It holds the result set stable for investigation. True push-based Streaming with configurable auto-scroll is on the roadmap. MVP real-time mode uses poll-based continuous refresh.
Sort and pagination
Every column in the results table is sortable. Select a column header to toggle ascending, descending, and cleared states. An arrow glyph on the header indicates the active sort.
Operators control pagination from the table footer. Operators choose the rows-per-page count from a fixed set:
10
25
50
100
250
500
Page navigation (first, previous, next, last, and direct page entry) is on the same footer. Sort and pagination state persist with the tab.
Operators can resize column widths by use of the header divider. Operators can drag the header to change column order. MetaDefender NDR saves both per user and per event bucket. Thus, column preferences applied to the DNS sub-tab carry across other DNS sub-tabs.
Show / hide column controls are on the roadmap. These controls choose which available fields render as columns. On MVP, the column set is the bucket-specific and sub-type-specific projection documented in Tab Types above.
Work with results
A row is the atomic unit the operator acts on.
Select a row. Select a row to open the detail sidebar on the right. See The Detail Sidebar below. The operator can select one row at a time.
Copy a value. Right-click a cell to show Copy in the context menu. See Right-Click Context Menus on Values below.
Pivot from a value. Right-click a cell to show pivot actions. The actions are Hunt all events from this IP, Show related events, and Show related files. Other actions are Search file hash across all events and Show all events with this community id. Each action opens a new tab pre-filtered to the selected value.
Export the result set. The tab exports to Comma-Separated Values (CSV) or JavaScript Object Notation (JSON) from the tab action menu. Export respects the active search, filters, time range, and sort; the row cap on export matches the platform limit documented in Data Retention
Multi-row selection and bulk actions are not part of MVP. These actions include assignment to an analyst, row tags, and row disposition. Operators who must route events to downstream systems use SIEM and syslog integrations. See Integrations
Detail sidebar
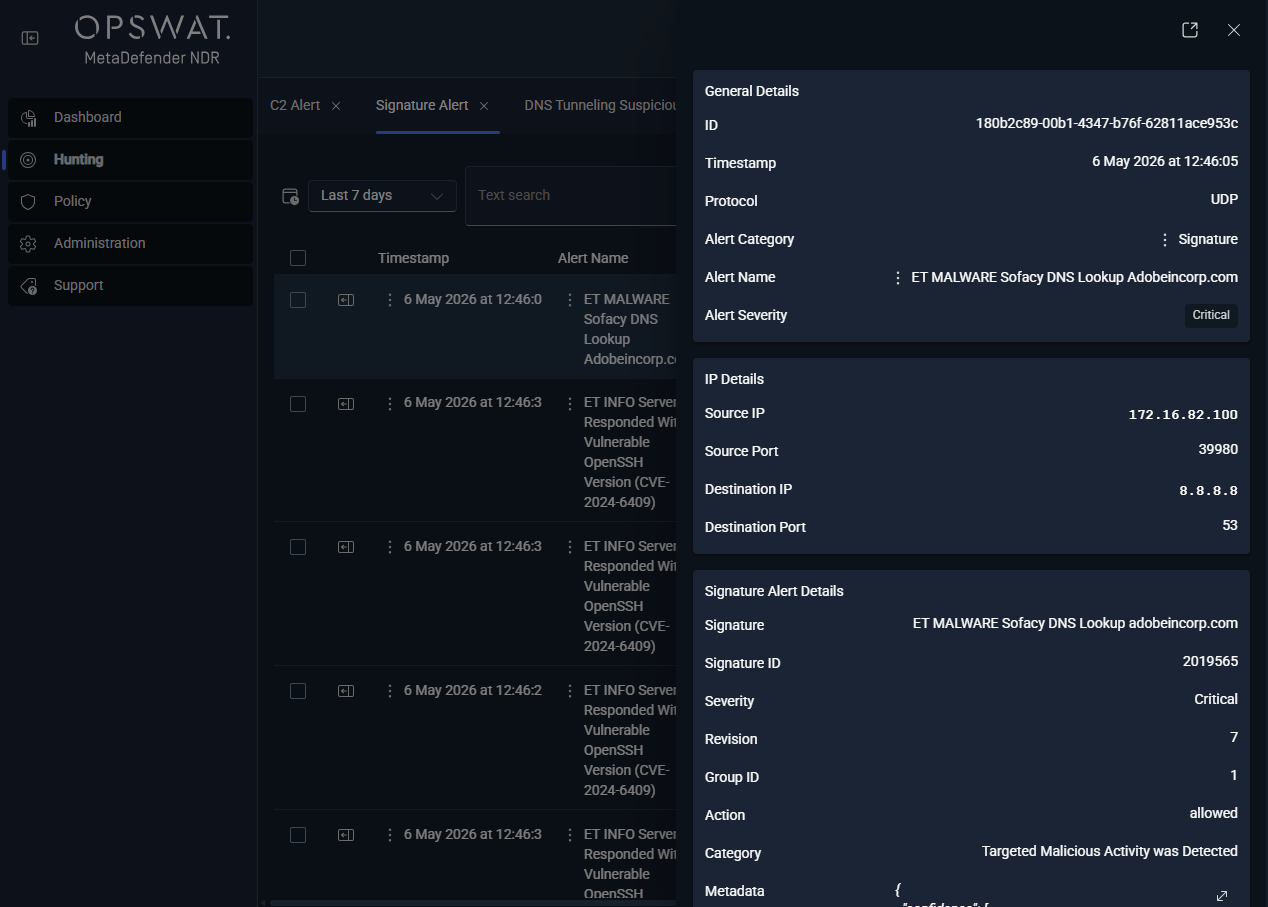
The detail sidebar is the collapsible pane on the right side of the page. It opens when an operator selects a row. It shows the full event with every available field in event-specific sections. It also shows enrichments that the pipeline attached.
Carousel multi-event navigation
The sidebar header shows next and previous controls. The controls step through the currently visible result page without closing the sidebar. Operators use the controls to move through a page of alerts end-to-end. They do not have to return to the table between rows. If a step passes the end of the current page, the first row of the next page appears. If a step goes before the first row, the last row of the previous page appears.
Type-specific renderers
The sidebar selects a renderer from the event blocks on the record. One record can use several renderers at once. For example, a DNS session row with a TIDB match shows the DNS section and the InSights Enrichment section. A FileInfo row with a MetaDefender Core hit shows the FileInfo section and the MDCore Enrichment section.
The renderers shipped on MVP:
Event Type | Sidebar Section | What it shows |
|---|---|---|
Signature Alert | Suricata Alert + Payload | Signature message, SID, revision, category, severity, and action. Also MITRE technique and tactic, affected product, attack target, malware family, author, confidence, rule metadata, and payload. |
DNS Event | Suricata DNS | Query name, record type, response code, answer data, TTL, query-or-answer flag. |
HTTP Event | Suricata HTTP | Hostname, URL, method, status, response length, user agent, referer, content-type, request and response headers. |
TLS Event | Suricata TLS | Version, SNI, subject, issuer, serial, fingerprint, JA3 / JA3S / JA4 fingerprints, cipher, validity window, session-resumed flag. |
SSH Event | SSH detail (generic ontology-driven block) | Protocol version, client and server software, HASSH fingerprints, key exchange and cipher algorithms. |
SMB Event | SMB detail (generic ontology-driven block) | Command, share, filename, access flags, status. |
RDP Event | RDP detail (generic ontology-driven block) | Client name, client build, cookie, version, certificate subject and issuer. |
SMTP Event | SMTP detail (generic ontology-driven block) | Mail-from, recipients, HELO, attachment filenames, reply codes. |
QUIC Event | Suricata QUIC | Version, SNI, JA3 / JA4 fingerprints, ALPN. |
FTP Event | FTP detail (generic ontology-driven block) | Command, command data, reply code. |
FileInfo Event | Suricata FileInfo | Filename, magic string, SHA-256, MD5, file size, state, stored flag. |
Flow Event | Suricata Flow | Packets to-server and to-client, bytes to-server and to-client, start, end, age, state, termination reason, alerted flag, transaction count, exception policy. |
MD Core Enrichment Section | MD Core | Scan result, threat name, positive engines over total engines, scan details per antivirus engine, cache-hit flag, file metadata (SHA-256, MD5, size, type). |
C2 Enrichment Section | C2 Infrastructure | Match type, matched value, confidence, score, source feed -- one block per C2-matched entity on the row. |
InSights Enrichment Section | InSights | Malicious flag, source tagging, matched entity -- one block per InSights-matched entity on the row. |
Behavioral Alert Sections | One section per detection nested key (Beaconing, Data Exfiltration, Long Duration, DNS Tunneling, DGA, Fast Flux, Port Scan, Connection Spray, and the composite aggregates) | Detection-specific metadata: connection counts, byte ratios, upload / download totals, window bounds, destination country / Autonomous System Number (ASN) / organization, malicious Indicators of Compromise (IOC) lists. |
Select the sidebar close control to return the full table width. Open another row in the same tab to mount the sidebar on the new row.
Right-click context menus on values
Every cell value in the results table and every field value in the sidebar exposes a right-click context menu. The menu carries two classes of action: copy and pivot.
Right-click pivots always open a new tab. MetaDefender NDR preserves the originating tab so the operator can return after a lead.
Action | Scope | What happens |
|---|---|---|
Copy to clipboard | Any cell or sidebar field value | MetaDefender NDR places the selected value on the system clipboard. |
Hunt all events from this IP | Any IP-valued cell (source or destination) | A new tab opens on All Events filtered to rows where the IP appears in either the source or destination 5-tuple position. The selected time range carries over from the originating tab. |
Show related files | Any row with a flow or session context | A new tab opens on the Files bucket. The tab filters to files observed on the same flow. This helps the analyst see what file transferred across a suspicious connection. |
Show related events | Any row | A new tab opens on All Events filtered to events that share the row's |
Search file hash across all events | Any file hash cell (SHA-256 or MD5) | A new tab opens on All Events. It filters to events that reference the hash. These events include the upstream HTTP download, the SMB write, and the downstream MDCore scan. |
Show all events with this community id | Any row with a | A new tab opens on All Events filtered to that |
Pivot between tabs
Pivot actions are the core investigation method on the Hunt page. An operator follows an indicator from one view into another. The filter set carries over.
Three pivots happen commonly:
Alert -> flow. An operator reviews an All Alerts row. The operator right-clicks the
community_idand selects Show all events with this community id. A new All Events tab opens with every protocol transaction, flow record, file extraction, and enrichment for that connection.Flow -> session. An operator reviews a long-duration flow on Netflows. The operator right-clicks the
community_idand selects Show related events. The new tab shows the DNS resolution, TLS handshake, and HTTP requests on that flow.Session -> file. An operator reviews an HTTP session. The operator right-clicks the row and selects Show related files. The new Files tab lists every file extracted from the same flow. It includes MetaDefender Core scan results when available.
The same pivots run from the sidebar. Right-click a value inside the sidebar to show the same pivot menu as the table row. Examples are an IP in the flow section, a hash in the fileinfo section, or a community_id header. Analysts can follow the indicator from the sidebar. They do not have to return to the table.
Roadmap additions include a dedicated correlation view. See Roadmap below. That view surfaces related events without an explicit pivot. A file-to-endpoint trace view is also on the roadmap. It shows the source -> file hash -> destination endpoints relationship directly.
Save Hunt context
MetaDefender NDR preserves Hunt context through the tab persistence model rather than through a dedicated saved-query UI.
What persists
MetaDefender NDR saves every tab to the user's workspace. For each tab the platform persists:
The bucket and detection type (which menu entry created it).
The selected time range.
The active quick-search text and advanced-search expression.
Column width and order customizations (scoped per event bucket).
Sort state and rows-per-page selection.
The page position.
If the operator signs out and back in, every open tab returns to the last-saved state. This works from the same browser or a different browser.
What does not persist
Row selection and sidebar-open state are transient. They reset at sign-in. Operators who must return to a specific row leave the tab open. They do not save the row directly.
Sharing a Hunt context
A named save / load / share workflow for complex queries is on the roadmap. This workflow lets an analyst give a query to a peer. It lets an incident responder capture the filter that scoped an investigation. It also lets a runbook reference a specific Hunt view by name. On MVP, analysts reproduce a peer's context manually. They apply the same menu selection, time range, and advanced-search expression. In incident documentation, they describe the applied filters instead of a stable identifier.
See also
Dashboard -- the overview surface that feeds Hunt via the Recent Alerts row action.
Detection Overview -- the catalog of detection families whose alerts land in All Alerts and its per-type sub-tabs.
Critical Alert Triage -- the runbook that uses the Hunt page end-to-end for first-response triage.
Alert, Flow, and PCAP Pivoting -- extended coverage of the pivot patterns introduced in this chapter.
Severity and Confidence -- the severity label definitions used in the alert columns.