MetaDefender NDR provides a dedicated set of Health and Performance dashboards in the Manager UI that deliver near real-time visibility into the platform itself -- the Manager, every adopted sensor, and every sensor group. This chapter describes the monitored entities, the metric categories the platform collects and visualizes, the specific visibility the Suricata stats.log feed provides, the real-time system-events stream, the dashboard layout, and the common operational procedures and troubleshooting patterns administrators apply when something on the platform is not behaving the way it should.
This chapter is written for system administrators, Site Reliability Engineers (SREs), shift leads, and on-call engineers who own MetaDefender NDR as an operational platform. It assumes an installed Manager with at least one adopted sensor, an administrator or SRE account, and familiarity with the Administration Page and the Daily Operations cadence.
First-use acronym expansions in this chapter: SRE (Site Reliability Engineer), MVP (Minimum Viable Product), UI (user interface), API (application programming interface), CPU (central processing unit), IOPS (Input/Output Operations Per Second), I/O (input/output), NIC (network interface card), IDS (Intrusion Detection System), IPS (Intrusion Prevention System), SIEM (Security Information and Event Management), MITRE ATT&CK (MITRE Adversarial Tactics, Techniques, and Common Knowledge), KPI (Key Performance Indicator), SLA (service-level agreement), SPAN (Switched Port Analyzer), TAP (Test Access Point), NTP (Network Time Protocol), DNS (Domain Name System), REST (Representational State Transfer), TLS (Transport Layer Security), NDR (Network Detection and Response), C2 (command-and-control).
Overview
The Manager UI exposes two distinct dashboards that should not be confused:
The analyst Dashboard -- documented in Dashboard -- surfaces threats: alerts, signature hits, Top-N source and destination entities, MITRE ATT&CK coverage, and the recent-severities distribution. It is the surface a Tier 1 or Tier 2 analyst opens at the start of a shift to scan the threat landscape.
The Health and Performance dashboards described in this chapter surface the platform: resource consumption, service uptime, capture performance, packet-drop percentage, integration connectivity, and the Suricata engine's own operating statistics. It is the surface an administrator, SRE, or shift lead opens to confirm the platform is healthy enough to be trusted with the analyst's work.
The two surfaces are complementary. An anomaly on the analyst Dashboard -- a sudden silence in the Recent Severities donut, a disappearance from Top Signature Hits -- is often the downstream symptom of a fault that the Health and Performance dashboards have already surfaced at the source. Operators consult both when diagnosing disappearing detections.
Health monitoring in MetaDefender NDR operates with a near-real-time latency target of under five seconds for critical metrics. The monitoring subsystem scales to 100-200 sensors per Manager instance depending on deployment tier, and its telemetry collection overhead on each sensor is kept minimal enough that it does not itself cause packet loss.
Monitored Entities
The Manager continuously monitors three classes of entity.
Entity Class | What the Manager watches |
|---|---|
Manager itself | The frontend, backend API, Kafka brokers, PostgreSQL, RisingWave stream processor, Elasticsearch, and every supporting service that makes up the Manager stack. Every layer the Manager operates on is visible to the monitoring subsystem. |
Individual Sensors | Every adopted sensor reports host-level resource telemetry, capture-interface counters, Suricata engine state, and the status of its local log-forwarding services. Each sensor's metrics are addressable independently. |
Sensor groups | Logical groups defined under Sensor Management roll up the member-sensor metrics into group-level aggregates. Administrators hunt platform issues at the group scale first -- "the west-coast data center group is suddenly dropping packets" -- before drilling to an individual sensor. |
All monitoring data is tenant-aware -- operators of multi-tenant deployments see only the Manager, sensors, and groups their tenant owns -- and exportable for compliance and external audit.
Core Metric Categories
The Manager collects metrics in five categories. Every category applies to the Manager and, where the metric is meaningful, to every sensor.
System resource
Resource metrics describe the host's general health. For the Manager, these are the metrics that determine whether the control plane has headroom; for a sensor, they are the early-warning indicators that a sustained traffic surge is pushing the host toward exhaustion.
CPU utilization. Per-core and aggregate utilization with a user-time / system-time / idle breakdown. The per-core view exposes the asymmetric load that capture-pinning and receive-side scaling produce on a sensor and the worker-thread concurrency a RisingWave job reaches on the Manager.
Memory consumption. Total, used, free, cached, and swap usage. Swap activity on any host is an actionable signal -- the sensor or Manager has outgrown its allocated memory for the current traffic rate.
Disk utilization. Percentage used and free per mount point. Retention floors (documented in Data Retention) rely on this metric to trigger the disk-pressure balancer.
I/O utilization. Read and write throughput, IOPS, queue depth, and latency. A saturated disk queue on the storage-backing Manager is a common upstream cause of search latency on the Hunt page.
Load average. One-minute, five-minute, and fifteen-minute load averages. Load divergence from CPU percentage is the characteristic signature of runnable-queue contention -- many processes waiting on the CPU rather than any one process pinned to a core.
Uptime and availability
Uptime metrics answer two questions: is the entity running, and how long has it been running since its last restart?
System uptime. Seconds since boot for the Manager and every adopted sensor. A surprisingly low uptime on a sensor is often the first indication of a crash-and-restart loop before any service-level alert reaches a human.
Per-service uptime, status, and utilization. Every critical NDR service on the Manager and the sensors reports its own status and resource consumption independently of the host. The signature process, the behavioral engine, the detection pipelines, and the log-forwarder processes each contribute a row to the service-health table.
Network and capture
Network and capture metrics cover the three interfaces that matter to the platform: the Manager's management interface, each sensor's native capture interface, and the internet egress the platform relies on to pull intelligence updates and reach third-party integrations.
Management-interface availability and utilization. Bandwidth and packet rate on the Manager's management network-interface card. Saturation on this interface competes with legitimate API traffic and is a triage candidate whenever the UI becomes sluggish across the fleet.
Native capture interface on each sensor. Per-sensor capture telemetry is the most operationally important metric in this category. The Manager tracks packets received, packets dropped at the kernel, packets dropped at the Suricata engine, packets processed, capture throughput in megabits per second, and the calculated packet-loss percentage. The packet-loss percentage is computed continuously in real time, not periodically.
Internet connectivity status and latency. A simple reachability check against configured update endpoints and integration endpoints. Sustained latency increases upstream are the common precursor to feed-update failures and MetaDefender Core integration timeouts.
A packet-drop percentage above zero on any sensor is a first-class actionable signal. The platform is designed for zero packet loss under normal operation; persistent drop indicates a capture configuration, a hardware sizing, or a network-path issue. The investigating packet drops procedure below is the starting runbook when the indicator turns non-green.
NDR service monitoring
NDR service monitoring tracks the process-level health of every critical service in the detection pipeline. The Manager tracks each service's run state, resource consumption, and queue backlog where applicable.
Suricata. Each sensor's Suricata IDS process is monitored for uptime, CPU and memory consumption, configured ruleset revision, active worker count, and per-worker saturation. Suricata's own
stats.logfeed supplements this view with engine-internal statistics -- described separately in Suricata <code>stats.log</code> Visibility.RisingWave. The RisingWave stream processor on the Manager is watched for its own process health and for the per-stream lag of every behavioral detection pipeline it runs.
Detection pipelines. Every Kafka consumer that drives a detection stage -- the enrichment services, the aggregator, the RisingWave detections, the Random Cut Forest anomaly pipeline, the alert engine -- reports its input rate, its output rate, and its consumer-group lag. Sustained non-zero lag on any consumer is the characteristic signal that a downstream stage is falling behind the sensor's ingest rate; the Identifying a sensor falling behind procedure walks the diagnostic.
Log forwarders and socket consumers. The processes that move events off of a sensor -- the Suricata-adapter that pulls from Suricata's Unix socket and publishes to Kafka, the log forwarders that ship system logs to a destination SIEM -- report their uptime and their consumption rate.
Third-party integration status
Every external integration the platform depends on is continuously health-checked. The integration-status view in the Manager lists every configured integration and its current reachability.
Suricata stats.log Visibility
Every sensor's Suricata engine emits a periodic stats.log file that exposes the engine's own internal operating statistics. The Manager parses this feed in real time from every sensor and maintains historical trending so that an operator can see the engine's behavior over an hour or a day, not only at the current instant.
The parsed stats.log view exposes:
Capture statistics. Kernel-level packet count and drop count. These are the ground-truth numbers that feed the packet-loss percentage calculation -- kernel drops happen before Suricata ever sees the packet and indicate a capture-path saturation rather than an engine-processing bottleneck.
Decoder statistics by protocol. Per-protocol packet counts (Ethernet, IPv4, IPv6, TCP, UDP, ICMP, VLAN, GRE, and so on). A protocol that disappears or drops dramatically is an early indication of a capture-path filter or a tapped-segment change.
Flow manager statistics. Active flows, flow table memcap usage, and flow-aging rates. Flow table saturation is the characteristic cause of session-event loss under heavy load.
Detection engine statistics. Total alerts generated, rules loaded, and the per-rule match rate. Used as a coarse detection-efficacy indicator and a sanity check after every signature update.
Output module statistics. EVE JSON emission rate and any output-queue backlog. Output saturation means Suricata is generating events faster than the local forwarder can ship them off host.
Thread utilization. Per-worker-thread CPU saturation and load. Asymmetric worker utilization points at a receive-side-scaling misconfiguration; uniformly saturated workers indicate the host is under-sized for the monitored traffic rate.
Historical trending on every stats.log metric is retained at a resolution appropriate to the metric's purpose. High-resolution detail is available for the most recent windows; longer windows are retained at reduced resolution so that the platform-storage footprint of monitoring is bounded.
Real-Time System Events
A live system-events section in the Manager UI streams status messages, warnings, and errors from the Manager and every sensor. The stream is sorted newest-first and is filterable by:
Sensor -- narrow the stream to events originating from one adopted sensor.
Group -- narrow to every sensor in a chosen group plus the Manager.
Severity -- the event severity emitted by the source service (informational, warning, error).
Time range -- constrain the stream to a specific investigation window.
Operators use this stream as the first port of call when the high-level dashboards show a fleet-level anomaly. A cluster of events from one sensor around the time a drop appeared on the capture-metrics view is typically enough to fingerprint the root cause.
The Health and Performance dashboards present the metric categories above in a set of purpose-built panels. The layout is consistent across deployments; administrators navigate from the fleet-wide view to an individual sensor's detail in a single drill-down step.
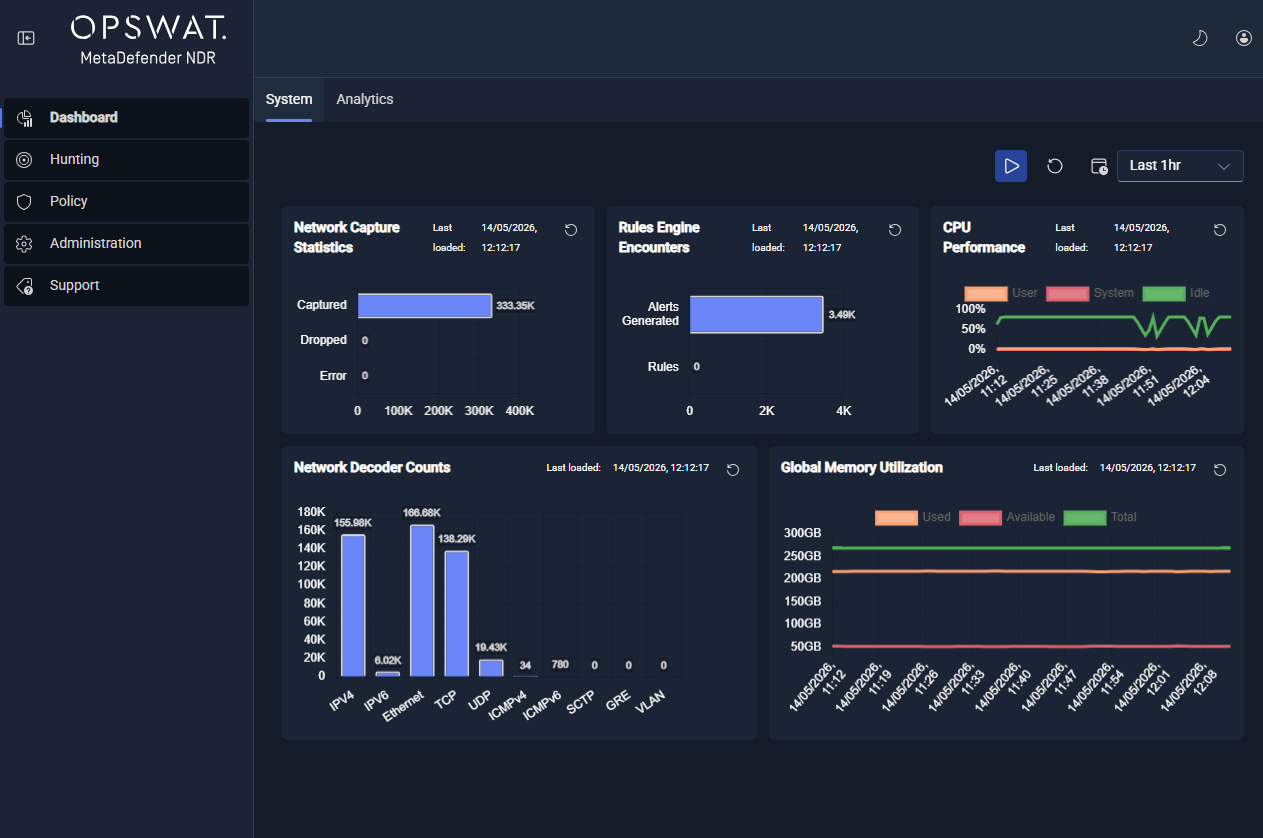
KPI cards. Real-time cards summarize the four metrics that drive every operator's first read: aggregate CPU, aggregate memory, aggregate packet-loss percentage, and the current alert rate. Each card carries a small trend indicator that shows whether the metric is climbing, flat, or falling relative to its recent baseline.
Trending charts. Line and area charts plot CPU, memory, packet loss, and capture throughput over a selectable time range. Every chart supports filtering by sensor or group so that one chart can display either a fleet-wide aggregate or a single sensor's trace.
Fleet-wide heatmap. A heatmap renders every sensor in the fleet as a coloured cell. Cell colour encodes overall sensor health -- green, amber, red -- and clicking a cell drills into that sensor's detail view. The heatmap is the most efficient way to identify an outlier in a large deployment.
Per-sensor detail views. Each sensor has a dedicated detail view that plots that sensor's full metric catalogue over the previous twenty-four hours at minimum. The detail view is the end point of a drill-down from a KPI, a chart, or a heatmap cell.
Top-N bar charts. Bar charts rank the fleet by the metrics most useful for operational triage -- top sensors by packet drops, top sensors by alerts generated, top sensors by resource usage.
Suricata stats.log visualizations. Decoder-breakdown panels, flow-engine performance panels, and per-worker-thread utilization panels present the parsed
stats.logdata in the form an engine operator expects to see it.
Every dashboard supports filtering by sensor group, individual sensor, and time range. Administrators save custom views for the specific aggregations they want to see at a glance; a saved view is recoverable across sessions.
Common Procedures
The procedures below are the routine operational patterns this chapter expects. They are referenced from the Daily Operations checklist and are the starting points for the troubleshooting patterns in the next section.
Investigating packet drops on a sensor
A non-zero packet-drop percentage on any sensor warrants investigation. The drop indicator on the sensor detail view is the entry point; the procedure below walks the diagnostic.
Confirm the drop is sustained, not a transient. Inspect the packet-loss line chart on the sensor's detail view across the previous fifteen to thirty minutes. A brief, isolated spike is often a traffic burst that exceeded the configured capture buffer; a sustained non-zero baseline is the actionable case.
Distinguish kernel drops from Suricata drops. The Suricata
stats.logpanel breaks the drop into the kernel-level count and the Suricata-level count. Kernel drops indicate a capture-path saturation -- the NIC, the ring buffer, or the capture threads cannot keep up. Suricata drops indicate an engine-processing saturation -- flow-table memcap pressure, detection-engine saturation, or output-module backpressure.Review CPU and thread utilization. The per-worker thread chart for the sensor identifies asymmetric saturation (one worker pinned while others idle), which typically points to a receive-side-scaling misconfiguration, or uniform saturation, which points to an under-sized host for the current traffic rate.
Check flow-table memcap. The flow manager statistics panel shows memcap usage. A flow-table at or near its configured memcap correlates with Suricata-level drops because new flows cannot be allocated.
Review the real-time system-events panel. Filter the events panel to the affected sensor for the window in which drops began. Explicit error or warning events frequently fingerprint the issue precisely.
Cross-check the upstream capture path. A drop that is not explained by any host-level metric is frequently an upstream problem -- a SPAN/TAP that has become oversubscribed, a change in the monitored traffic volume, or a physical-layer fault. Engage the network-engineering team if nothing on the sensor itself explains the drop.
Document the outcome of the investigation in the site's operational log. Sustained drops that remain unresolved after the host-level and upstream checks are a capacity question and feed into the monthly sensor-placement review described in Daily Operations.
Identifying a sensor falling behind
A sensor that is ingesting events but whose detections are arriving late is a different failure mode from a sensor dropping packets at capture. This case shows up as consumer-group lag on the detection pipeline, not as a capture-drop indicator.
Check detection-pipeline lag. Open the NDR service monitoring panel and look at the per-consumer-group lag for the enrichment services, the aggregator, and the alert engine. Non-zero, growing lag on any consumer group is the characteristic signal.
Correlate to sensor ingest rate. Compare the lagged consumer's input rate to the sensor's capture throughput. A sensor whose throughput spiked recently and whose consumers have not caught back up is the common case.
Review RisingWave stream lag. The RisingWave per-stream lag view reports the same class of signal for the behavioral detection pipelines. A single stream that is lagging while others are current fingerprints the faulty pipeline.
Review the Suricata output module. Output-queue backpressure on Suricata itself -- visible in the stats.log output-module panel -- causes upstream events to pile up at the sensor rather than cross into the Manager promptly.
Plan recovery. A one-time catch-up typically resolves by itself once the transient subsides; a recurring pattern is a capacity signal and feeds into the same weekly sensor-health review described in Daily Operations.
Planned-maintenance procedure
Planned maintenance on the Manager or on a sensor -- a software update, a host reboot, a capture-interface reconfiguration -- follows a three-step pattern that keeps the operational record clean and preserves the ability to verify recovery afterwards.
Notify. Post a maintenance window notice through the site's operational-communications channel. Include the target entity (Manager, specific sensor, or group), the planned start and end times, the operator identity, and the change reference the work is being performed against. Shift leads expect this notice to appear before the maintenance begins so that any alert anomaly during the window is interpreted correctly.
Record the start time. When the maintenance begins, record the start timestamp in the site's change log. The Manager itself does not gate on maintenance windows in MVP; recording start and end times is the mechanism by which operators distinguish expected-during-maintenance behaviour from unexpected platform events.
Record the end time and verify. When the maintenance completes, record the end timestamp in the same log, then run the Daily Operations checklist against the entity that was serviced. A post-maintenance verification confirms that ingestion has resumed, that packet drops are back to their baseline, that detection pipelines are current, and that no service-down condition is sitting in the system-events stream. An unverified maintenance is not considered complete.
Troubleshooting
The table below captures the four most commonly-reported health conditions, their typical root causes, and the resolution steps operators apply. The table is not exhaustive -- deeper investigation paths live in the service-specific sections above and in the Sensor Management troubleshooting section.
Symptom | Likely Cause | Resolution Steps |
|---|---|---|
Sensor shows offline or missing | The sensor's management connection has dropped, the sensor host is down, or a firewall rule between sensor and Manager has blocked the outbound control channel. | Confirm the sensor's host is up and reachable. Verify the Manager's management endpoint is reachable from the sensor's network segment. Review the sensor's system-events entries immediately before the offline transition -- the cause is usually in the last minute of that stream. Restart the sensor's management-channel service if the host is up but the connection is not recovering. Escalate to certificate re-issue only if the control-channel TLS handshake is failing. |
Sensor reports packet loss above zero | Capture-path saturation (kernel drops), engine-processing saturation (Suricata drops), flow-table memcap exhaustion, or an upstream SPAN/TAP oversubscription. | Run the packet drops investigation procedure end to end. Distinguish kernel versus Suricata drops from the |
High resource usage on Manager or sensor | Sustained traffic surge, a runaway worker process, or a slow downstream storage backend causing upstream queue backpressure. | Review the trending resource charts to establish whether the surge is a step change or a trend. Check the per-service uptime table for any recently-restarted process that may be looping. Cross-check the detection-pipeline lag chart -- backpressure at the storage layer often shows up first there. If a single service on the Manager is consuming disproportionate CPU or memory, restart that service only after recording current state for the post-mortem. |
Integration reports failure | The external endpoint is unreachable, authentication has expired or been rotated, the rate-limit budget on the integration account is exhausted, or a DNS or upstream proxy change is blocking the connection. | Open the integration-status view and read the specific failure reason reported by the Manager. Confirm basic connectivity from the Manager to the integration endpoint (DNS resolution, TLS handshake, HTTP reachability). Confirm credentials against the integration provider's console. For MetaDefender Core or Recorded Future, confirm the rate-limit budget has not been exhausted. Re-apply configuration through the configuration broadcast once the external issue is resolved; no service restart is required. |