The MetaDefender NDR Dashboard is the default landing surface for authenticated operators. It aggregates near real-time detection, traffic, and health telemetry into a grid of widgets so analysts can see the state of the environment at a glance before pivoting into investigation. This chapter explains the default layout, how streaming and refresh behavior works, how operators customize the widget grid, and how each widget is sourced and interpreted.
This guide is written for Tier 1, 2, and 3 Security Operations Center (SOC) analysts, threat hunters, and system administrators who monitor MetaDefender NDR daily. It assumes a running deployment with user access and at least one active sensor feeding events.
First-use acronym expansions in this chapter: SOC (Security Operations Center), KPI (Key Performance Indicator), MITRE ATT&CK (Adversarial Tactics, Techniques, and Common Knowledge), ML (machine learning), IP (Internet Protocol), TCP / UDP / ICMP / SCTP / GRE / VLAN (network protocol abbreviations), CPU (central processing unit), PDF / PNG / CSV (export formats).
Overview
The Dashboard answers the question "what is the state of the environment right now?" Operators use it to:
Confirm the detection pipeline is producing alerts and the sensor plane is capturing traffic.
Spot spikes in alert volume, severity, or a specific signature before they are reported as incidents.
Review the top entities (source IPs, destination IPs, destination ports, signatures) contributing to recent detections.
Verify host-side health of the Manager and sensor fleet (CPU, memory, capture statistics).
Launch a focused investigation by opening a recent alert in the shared Hunt sidebar.
The Dashboard is a snapshot surface, not a pivot surface. With one exception (Recent Alerts), widgets do not deep-link into the Hunt Page; operators who need to pivot on an entity value do so manually from Hunt. This is an intentional separation of concerns: the Dashboard exists to orient the analyst, and the Hunt page exists to investigate.
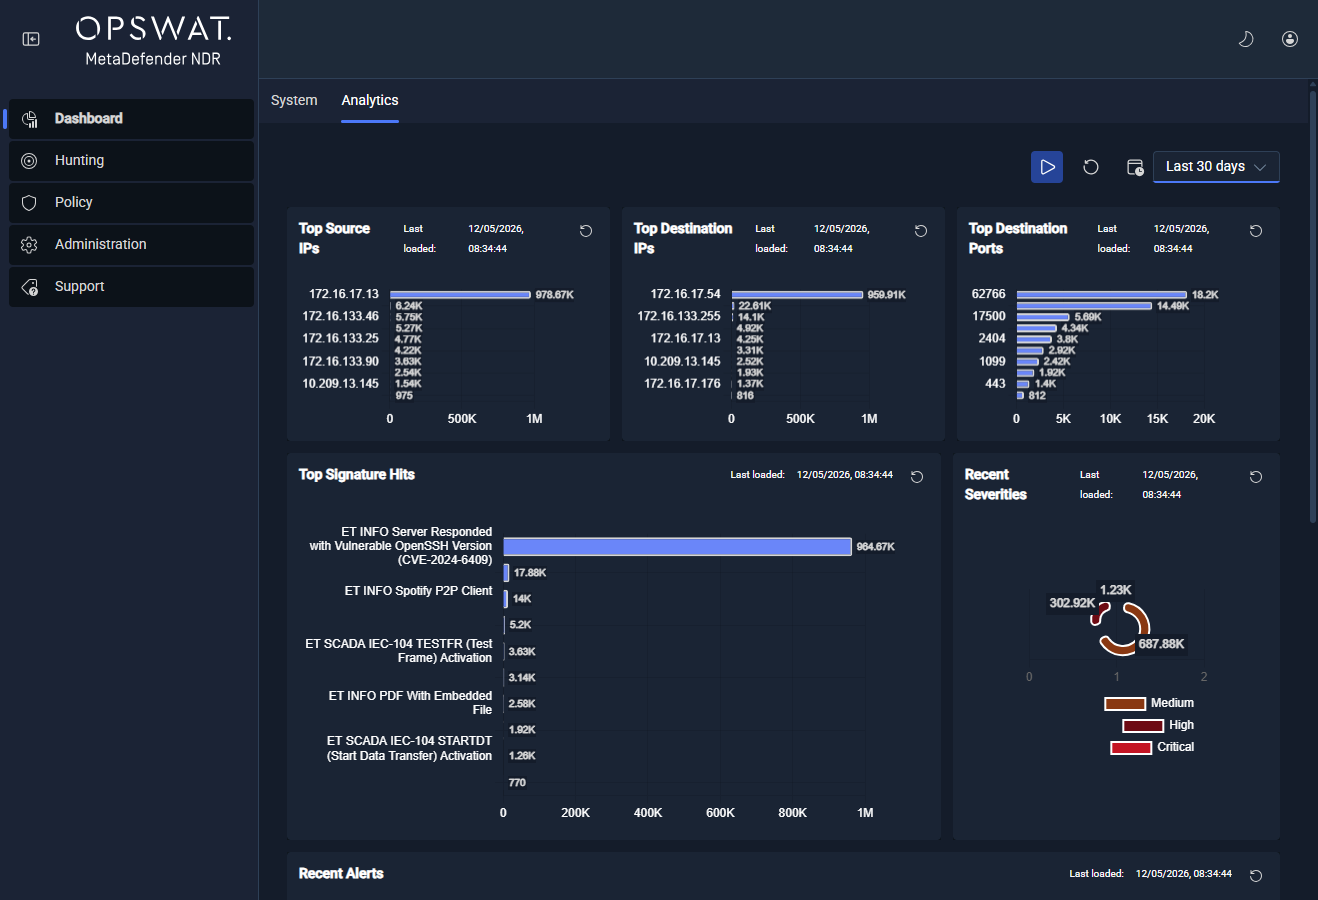
Subject: Analyst home dashboard with the default Analytics tab open, showing Top Source IPs, Top Destination IPs, Top Destination Ports, Top Signature Hits, Recent Severities, and Recent Alerts.
The Default Dashboard
The Dashboard ships with two built-in tabs. Operators land on Analytics on first login; both tabs are closeable and can be re-opened from the tab bar.
Tab | Purpose | Widgets |
|---|---|---|
Analytics | Detection-facing overview -- who or what is triggering alerts | Top Source IPs, Top Destination IPs, Top Destination Ports, Top Signature Hits, Recent Severities, Recent Alerts |
System | Platform-facing overview -- is the pipeline healthy | Network Capture Statistics, Rules Engine Counters, CPU Performance, Network Decoder Counts, Global Memory Utilization |
Tab model
Tabs are managed by the product-wide tab framework. Operators can close a tab using the close control on the tab header, and re-create Analytics or System tabs from the + menu in the tab bar. Tab state persists per user: closing Analytics and opening System on one session restores that same configuration on the next login.
Analytics tab layout
The Analytics tab uses a three-row grid:
Row 1 -- three equal columns: Top Source IPs - Top Destination IPs - Top Destination Ports.
Row 2 -- two columns in a 2:1 ratio: Top Signature Hits (wider) - Recent Severities (narrower).
Row 3 -- one full-width row: Recent Alerts (paginated table).
System tab layout
The System tab uses a two-row grid:
Row 1 -- three equal columns: Network Capture Statistics - Rules Engine Counters - CPU Performance.
Row 2 -- two equal columns: Network Decoder Counts - Global Memory Utilization.
Real-Time Streaming and Pause / Resume
The Dashboard targets near real-time visibility with sub-10-second end-to-end latency and refreshes by periodic poll on MVP. Two page-level controls govern refresh behavior, and two manual controls force an immediate refetch.
Control | Location | Effect |
|---|---|---|
Historic interval | Sticky header, left selector | Sets the back-window every widget queries against. Options: Last 1hr, Last 2hrs, Last 3hrs, Last 6hrs, Last 12hrs, Last 24hrs, Last 7 days, Last 30 days. Default: Last 1hr. |
Reloading interval | Sticky header, right selector | Sets the auto-refresh cadence for every widget on the page. Options: Every 10 seconds, Every 30 seconds, Every 1 minute, Every 5 minutes, Every 10 minutes, Every 30 minutes, Every 1 hour. Default: Every 5 minutes. |
Manual page refresh | Sticky header, refresh icon | Forces every widget on the current tab to refetch immediately. |
Manual widget refresh | Per-widget header, refresh icon | Forces a single widget to refetch immediately, independent of the page tick. |
Pause / Resume
Operators who need to study a snapshot without the grid shifting under them can pause auto-refresh by selecting the longest reloading interval, then resume continuous updates by returning to a shorter cadence. A dedicated global Pause / Resume toggle for streaming ingestion is planned as part of the real-time streaming work (see Roadmap below).
Latency characteristics
Widget refresh is driven by periodic poll against the Analytics Application Programming Interface (API), Prometheus, and Elasticsearch. Under the default Every 5 minutes cadence, the most recent alert appears on the Dashboard within five minutes of landing in storage. Operators who need tighter feedback set the cadence to Every 10 seconds or Every 30 seconds, at the cost of increased query load on the backing services. Very large historic windows (Last 7 days, Last 30 days) increase query latency and sample counts, so operators widen the historic window only when they need the longer view.
Customizing Layouts
The Dashboard grid is configurable per user. Operators enter configuration mode from the gear icon in the sticky header; in configuration mode each widget slot exposes controls for swapping the widget, adjusting the slot ratio, and removing the slot.
Drag-and-drop widget positioning, creating named user-defined dashboards, and the full save / rename / duplicate / delete lifecycle across named dashboards are planned for a later release and are listed under Roadmap. On MVP, layout customization applies to the two built-in tabs.
Action | How | Persistence |
|---|---|---|
Swap a widget | In configuration mode, open the widget selector in a slot header and choose a different widget. | Saved per user. |
Resize a slot | In configuration mode, adjust the slot's ratio control. | Saved per user. |
Remove a slot | In configuration mode, click the delete control on the slot. | Saved per user. |
Add a tab | Click the | Saved per user; tabs persist across sessions. |
Close a tab | Click the close control on the tab header. | Saved per user. |
Reset a tab | Close the tab, then re-open it from the | Saved per user. |
Widget Catalog
The table below lists every widget referenced by the Dashboard. Widgets marked MVP ship in the default tabs; widgets marked Roadmap are specified in the Dashboard Functional Requirements Document (FRD) and will ship in a later release.
Widget | Family | Visualization | Data Source | Drill-Down | Status |
|---|---|---|---|---|---|
Top Source IPs | Top-N | Horizontal bar chart, 10 bars ordered by alert count | Analytics API ( | None (manual pivot on Hunt) | MVP |
Top Destination IPs | Top-N | Horizontal bar chart, 10 bars | Analytics API ( | None (manual pivot on Hunt) | MVP |
Top Destination Ports | Top-N | Horizontal bar chart, 10 bars | Analytics API ( | None (manual pivot on Hunt) | MVP |
Top Signature Hits | Top-N | Horizontal bar chart, 10 bars; long signature names wrap at 24 characters | Analytics API ( | None (manual pivot on Hunt) | MVP |
Recent Severities | Detection | Doughnut chart with segments for Critical, High, Medium, Low, Unknown | Analytics API ( | None | MVP |
Recent Alerts | Detection | Ontology-driven table, 10 rows per page | Elasticsearch Universal API ( | Yes -- row action opens the Hunt sidebar in place | MVP |
Network Capture Statistics | Network activity | Bar chart -- three bars: Captured, Dropped, Error | Prometheus counters ( | None | MVP |
Network Decoder Counts | Network activity | Bar chart -- ten bars: IPv4, IPv6, Ethernet, TCP, UDP, ICMPv4, ICMPv6, SCTP, GRE, VLAN | Prometheus counters ( | None | MVP |
Rules Engine Counters | Network activity | Bar chart -- two bars: Alerts, Rules | Prometheus counters ( | None | MVP |
CPU Performance | System health | Line chart, three series: User, System, Idle | Prometheus range query ( | None | MVP |
Global Memory Utilization | System health | Line chart, three series: Used, Available, Total | Prometheus range queries ( | None | MVP |
Threat Overview KPIs | Summary KPI card | KPI cards with trend arrows for total alerts, critical alerts, unique threat actors, anomaly count, risk score | Analytics API | Planned | Roadmap |
Event Volume Over Time | Time series | Interactive line / area chart of event volume by type and severity | Analytics API | Planned | Roadmap |
Top Protocols | Top-N | Pie or donut chart of protocol distribution | Analytics API | Planned | Roadmap |
Top Threat Actors / MITRE Techniques | Summary KPI card | Treemap or heatmap | Analytics API | Planned | Roadmap |
File Extraction Summary | File scanning | Table of recently extracted files with MetaDefender Core risk scores | Elasticsearch Universal API over | Planned | Roadmap |
Anomaly Score Trend | ML | Line chart of ML anomaly scores over time with configurable thresholds | ML detections API | Planned | Roadmap |
Notes on widget behavior
Top-N bar labels smooth visually for presentation. The displayed bar length on Top-N widgets includes a small cosmetic offset so the chart remains readable when counts are close; the server-side totals are authoritative. Operators who need exact counts use the Hunt page quick-filter and column aggregate.
Recent Alerts sidebar. Opening an alert row mounts the same Hunt sidebar used on the Hunt Page. The sidebar renders the full event detail with entity enrichments, flow context, and file-scan results where available. Closing the sidebar returns to the Dashboard; sidebar state does not survive a page refresh.
Top-N pivots. The four Top-N widgets do not click through. Operators who want to investigate a specific source IP, destination IP, destination port, or signature copy the value from the widget label and apply it as a filter on the Hunt Page.
Rules Engine Counters label. The widget header reads "Rules Engine Encounters" in the current build; the value is the count of rule encounters (alerts plus loaded rules).
Top Destination Ports field contract. The server response for Top Destination Ports currently exposes a loosely-typed field contract; the ontology-backed type is planned for a subsequent release. Operators see correct values but may observe empty entries if the backing query returns an unexpected shape.
Visualization Types
The Dashboard widget framework is designed to support the following visualizations as it matures. The MVP column lists which visualization types are present in shipped widgets; the remainder are Roadmap and are specified in the Dashboard FRD.
Every widget is designed to support filtering, drill-down to a pre-filtered Hunt Page, and export of the underlying data once those capabilities are exposed platform-wide.
Visualization | Status | Used By |
|---|---|---|
Bar chart (vertical, horizontal, stacked, grouped) | MVPBar chart (vertical, horizontal, stacked, grouped) | Top Source IPs, Top Destination IPs, Top Destination Ports, Top Signature Hits, Network Capture Statistics, Network Decoder Counts, Rules Engine Counters |
Pie / donut chart | MVPPie / donut chart | Recent Severities (donut) |
Line / area chart (time series, zoom) | CPU Performance, Global Memory Utilization | MVLine / area chart (time series, zoom) |
Heatmap / treemap | -- | RoadmapHeatmap / treemap |
Sankey diagram (network flow visualization) | -- | RoadmapSankey diagram (network flow visualization) |
Geographic map (GeoIP-based) | -- | RoadmapGeographic map (GeoIP-based) |
MITRE ATT&CK heatmap / matrix | -- | RoadmapMITRE ATT&CK heatmap / matrix |
KPI card (number, trend arrow, sparkline) | -- | RoadmapKPI card (number, trend arrow, sparkline) |
Top-N list / table | Recent Alerts (ontology-driven table) | MVPTop-N list / table |
Attack storyline / timeline | -- | RoadmapAttack storyline / timeline |
MITRE ATT&CK Framework Dashboard
A dedicated, out-of-the-box MITRE ATT&CK Framework Dashboard is part of the MetaDefender NDR roadmap. When delivered, it will:
Present the enterprise MITRE ATT&CK matrix as an interactive heatmap colored by the count of detections per technique.
Surface only the subset of tactics and techniques the MetaDefender NDR detection pipeline observes (not the full external matrix), so the heatmap reflects achievable coverage.
Support drill-down from a technique cell into a Hunt page tab pre-filtered to alerts mapped to that technique, with the historic interval propagated from the Dashboard.
Refresh on the page tick with no additional configuration, using the same backing real-time pipeline as the Analytics tab.
MITRE technique mappings are already attached to alerts by the detection pipeline, and operators filter on technique identifiers today on the Hunt Page.
Filtering Across the Dashboard
On MVP, every Dashboard widget honors a single shared filter: the historic interval selected in the sticky header. Changing the historic interval re-queries each widget against the new back-window; the effect is visible on the next page tick (or immediately after a manual page refresh).
Additional cross-cutting filters -- event type, severity, MITRE technique, threat actor, source or destination entity, protocol -- are Roadmap. The Dashboard FRD specifies these as page-level filters so that, for example, selecting severity = Critical in a future release will re-query every widget against the same severity constraint. On MVP, operators who need to narrow by any of these dimensions do so on the Hunt page, which applies the full filter grammar.
Exporting
Export of dashboard views and data to Portable Document Format (PDF), Portable Network Graphics (PNG), and Comma-Separated Values (CSV) is Roadmap and is defined in the Dashboard FRD. The planned behavior is:
PDF -- full-page render of the current tab, preserving widget order and the active historic interval.
PNG -- per-widget and full-tab image export.
CSV -- export of the backing dataset for any data-bearing widget (Top-N, Recent Alerts, Severities, Prometheus counters).
Operators who need to extract underlying data do so from the Hunt page (row selection and download) or from the integrations layer (Security Information and Event Management (SIEM) forwarding, Syslog).
Drill-down Behavior
One widget supports in-place drill-down on MVP.
Widget | Drill-Down Path | What Opens |
|---|---|---|
Recent Alerts | Row action button on any alert row | The Hunt page sidebar mounted in place, showing the full alert with entity enrichments, flow context, and file-scan results |
All other widgets are non-interactive on MVP -- chart bars, doughnut segments, and time-series points do not click through. Operators who want to investigate an entity value surfaced by a Top-N or KPI widget copy the value and apply it as a filter on the Hunt page using the quick-filter or the right-click pivot on the detail sidebar. The Hunt page chapter documents both pivot paths.
Click-to-filter drill-down from every widget to a pre-filtered Hunt page tab is the Dashboard FRD target for the full MVP end-state and is tracked under Roadmap.
See Also
Hunt Page -- the primary investigation surface, reached manually from Dashboard entity values and automatically from the Recent Alerts row action.
Daily Operations -- the daily cadence that uses the Dashboard as its first checkpoint.
Health and Monitoring -- deeper view of platform health than the System tab exposes.