
File Audit Trail captures the full path a file travels across your systems into a single trace view, from the origin, each relay handoff, and the MetaDefender Core that scanned it.
Use it to investigate how a specific file was handled. For example, confirm a file captured at a Kiosk was scanned before Managed File Transfer delivered it, or check whether Deep CDR changed the file along the way.
Supported Products
MetaDefender Kiosk version 4.8.5 or later
MetaDefender Drive version 4.4.9.13544 or later
MetaDefender Managed File Transfer version 3.11.6 or later
MetaDefender Endpoint version 7.6.2609.1120 or later
On This Page
Before You Begin
What To Know | Details |
|---|---|
Only applies to new records | Records created before this feature release will not show File Audit Trail, historical data is not backfilled. |
Instance details come from My OPSWAT Central Management inventory | Fields like Group, Policy, and Tags are pulled from My OPSWAT Central Management in real time. If an instance has been removed or you lack access, those fields display |
No additional permissions needed | If you can already view processing history or file records, you can access the file lifecycle traceability |
Timestamps follow your console's configured time zone | All steps in the timeline reflect the time zone configured in your console |
Open File Audit Trail
The File Audit Trail view lets you see the full path a file traveled, the scan outcome at each Core, and whether sanitization changed the file.
Steps | Do this |
|---|---|
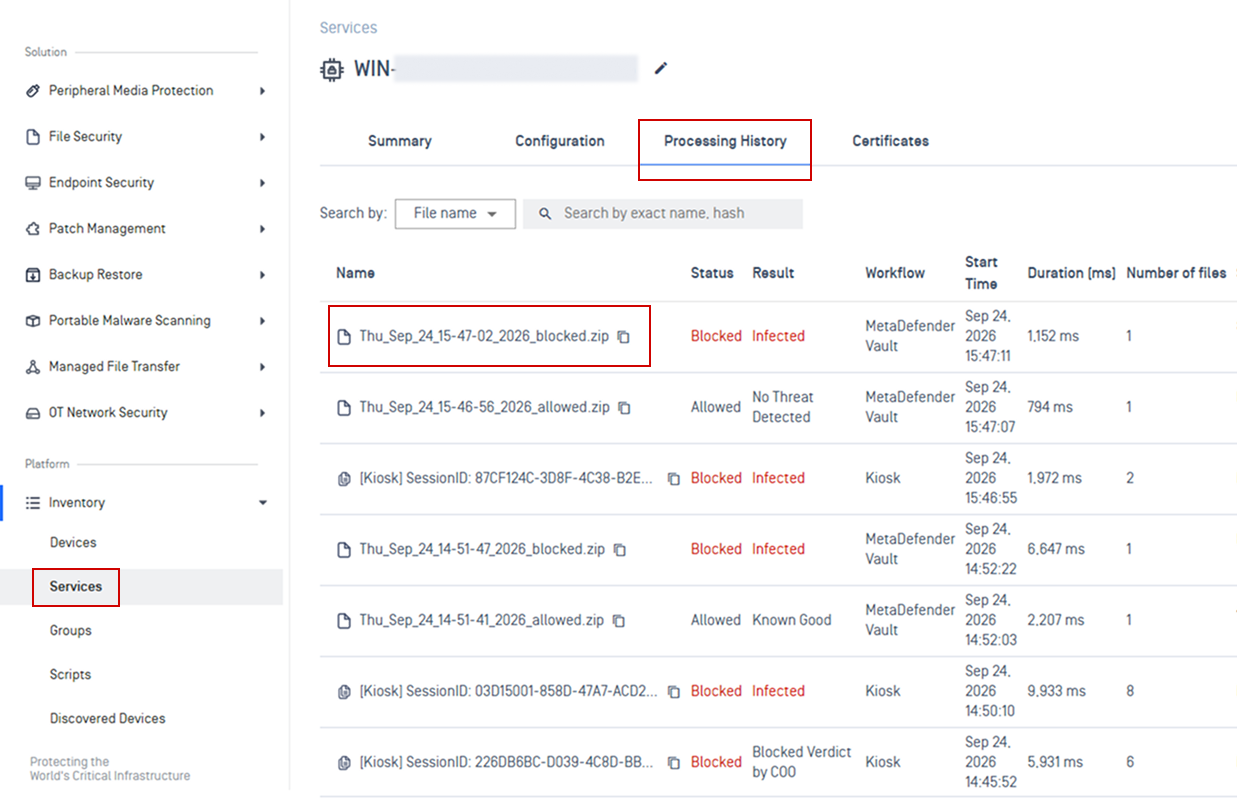
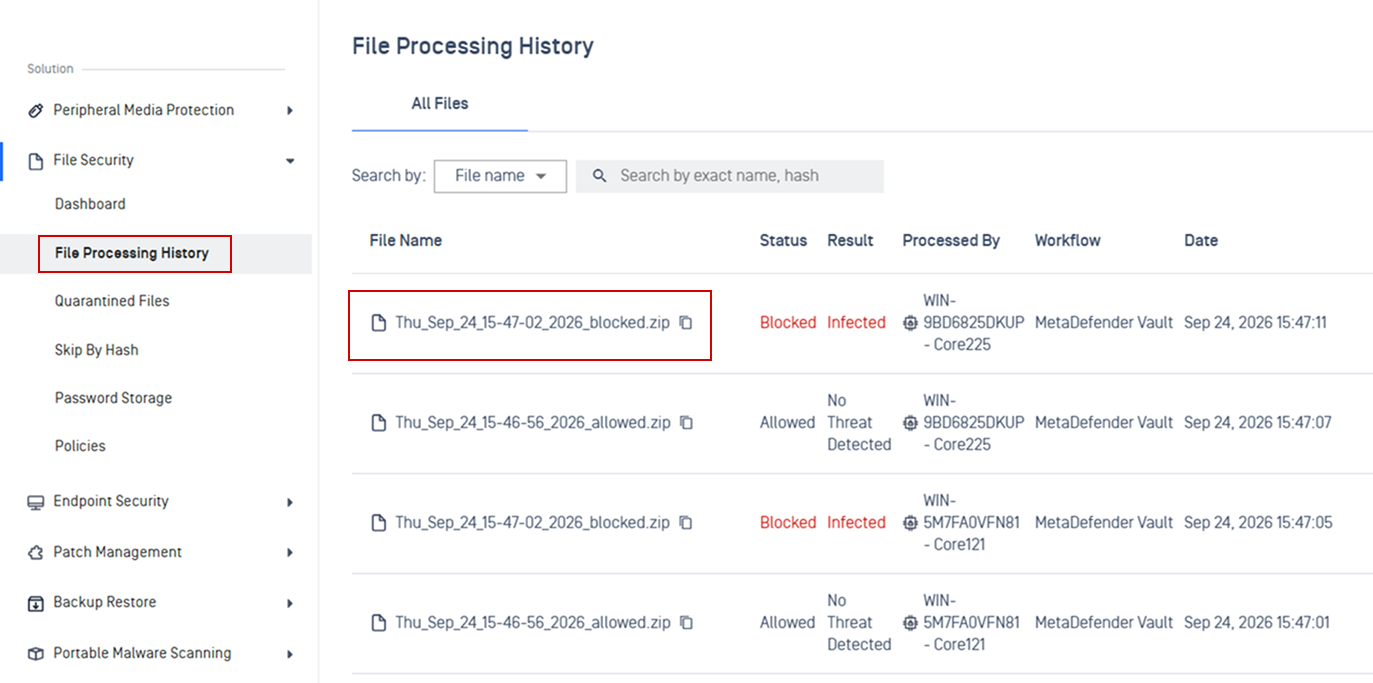
Step 1: Open a Processing History records | You can open a Processing History from one of the following locations:
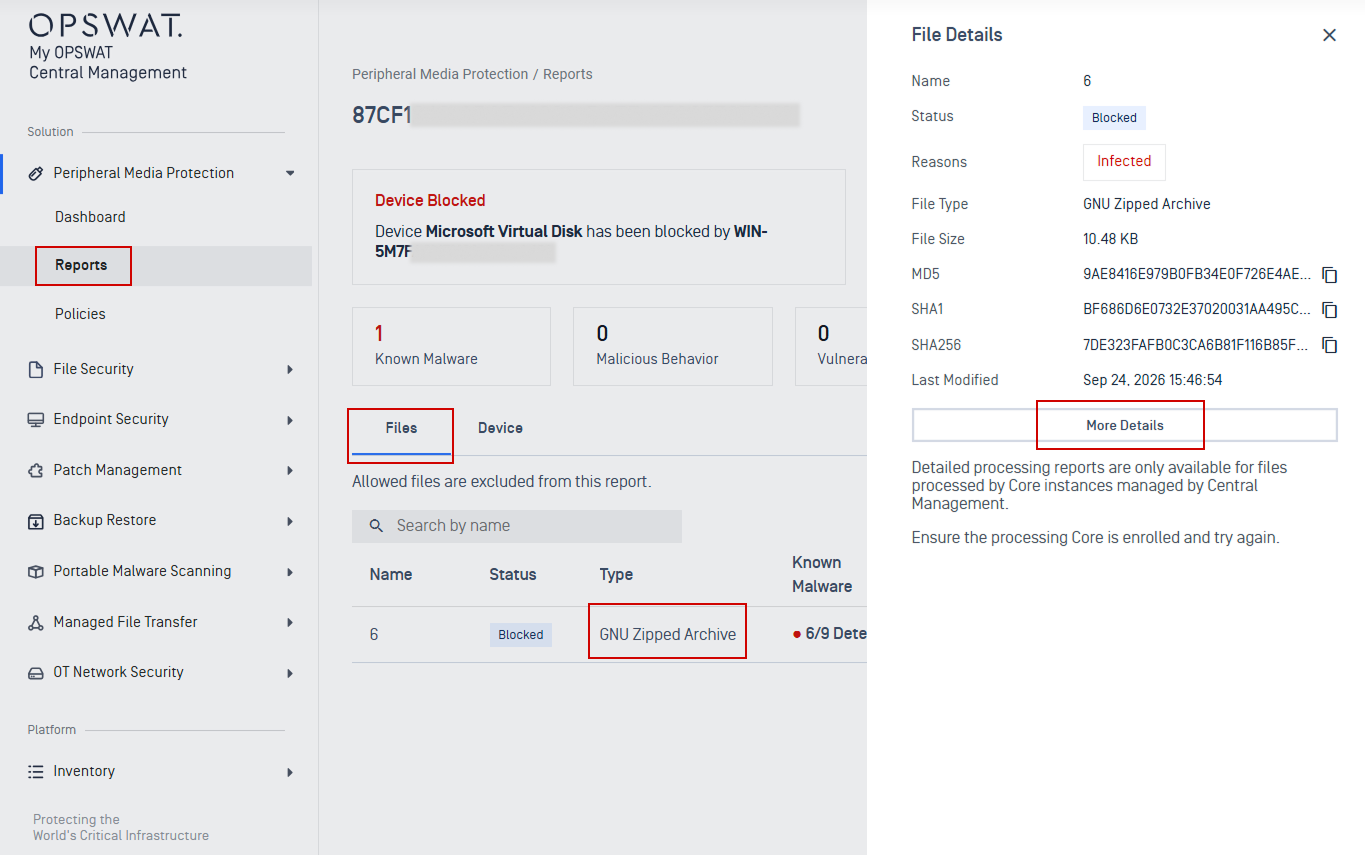 |
Step 2: Click View Audit Trail to open full audit view | Once inside the file processing record, click View Audit Trail to open the full audit view. 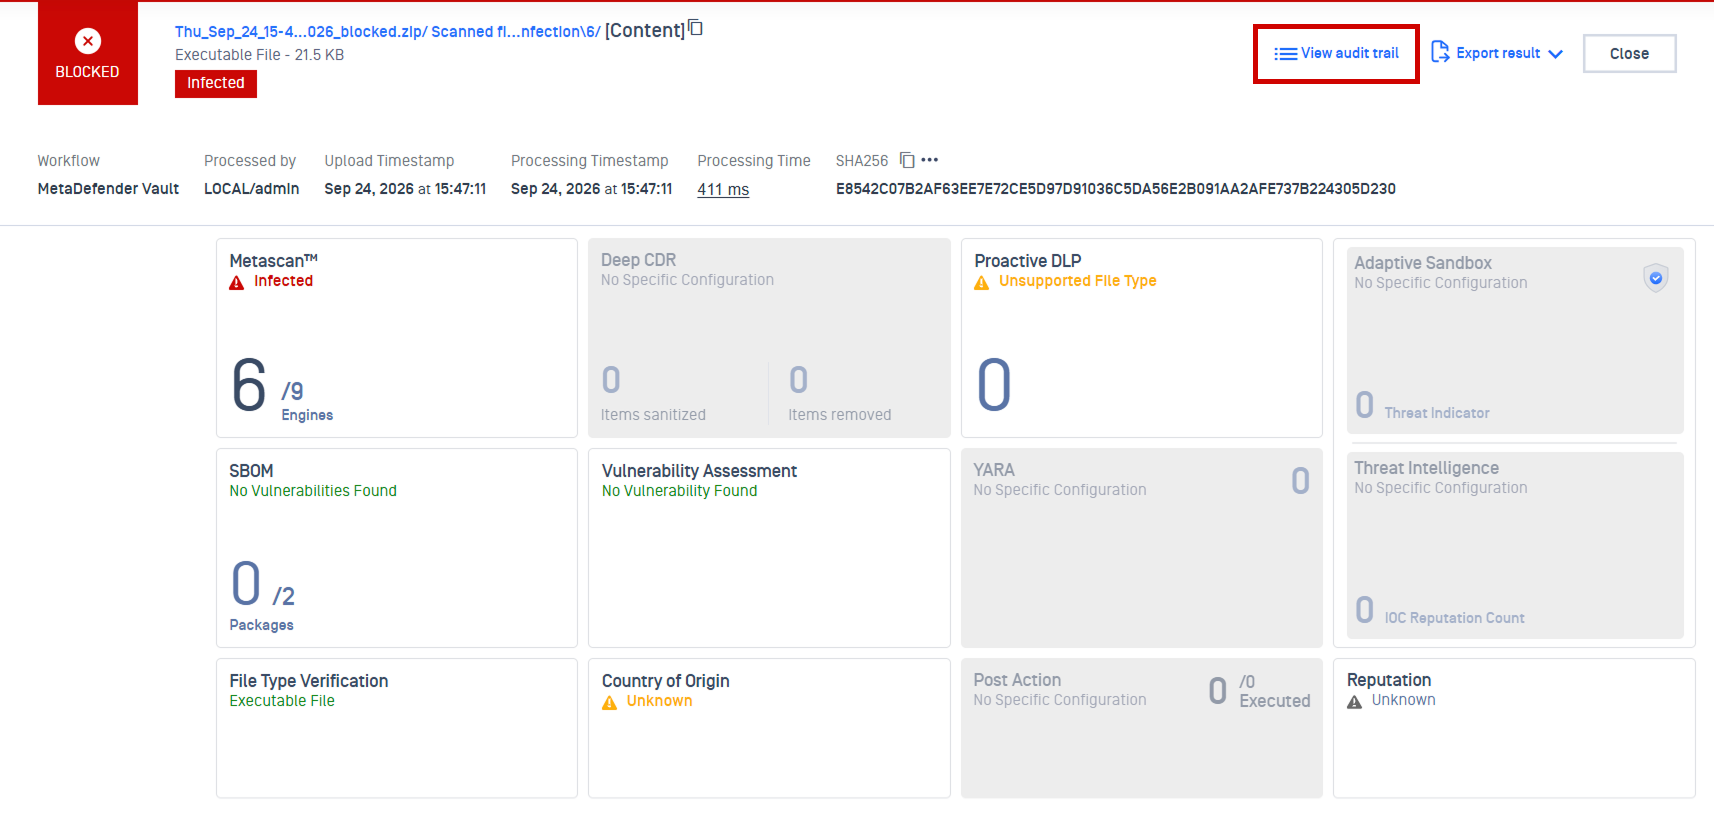 |
How to Read the File Audit Trail
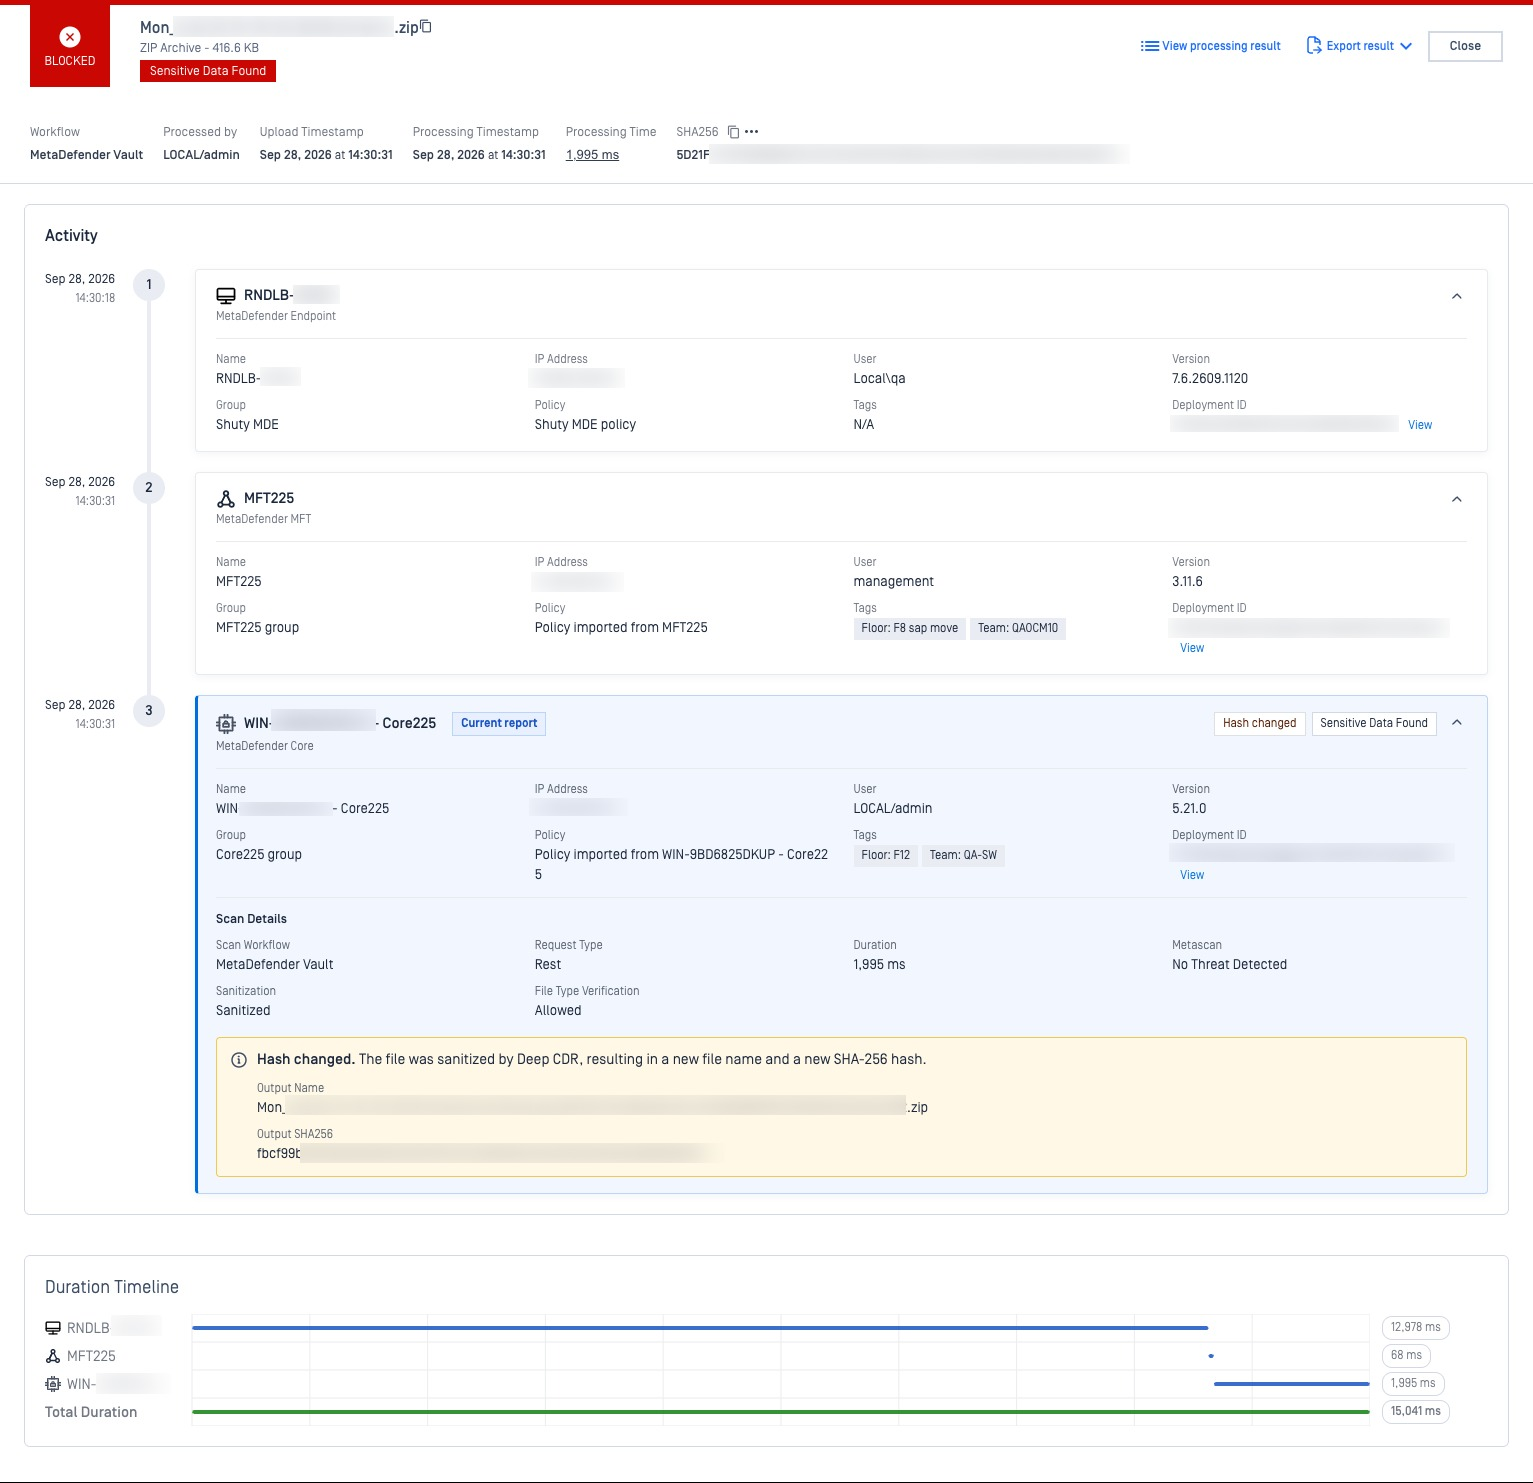
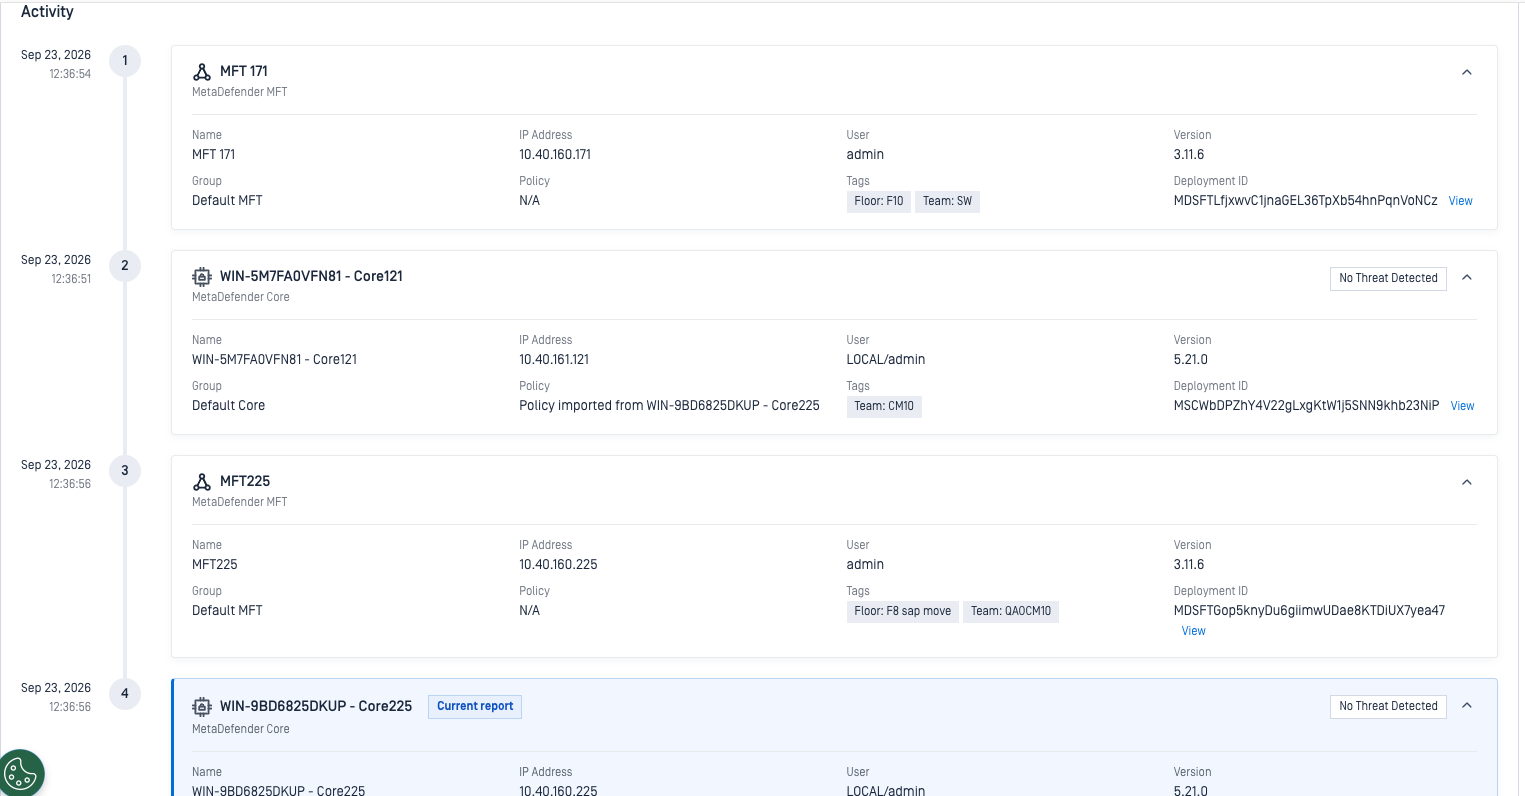
The Activity section displays a chronological timeline of how a file moved through OPSWAT products. Each step in the timeline represents an action performed by a specific product.
Goal | Sections |
|---|---|
Identify which products processed the file | Product Details: Instance name, product type, IP address, version, and organizational info (group, policy, tags) 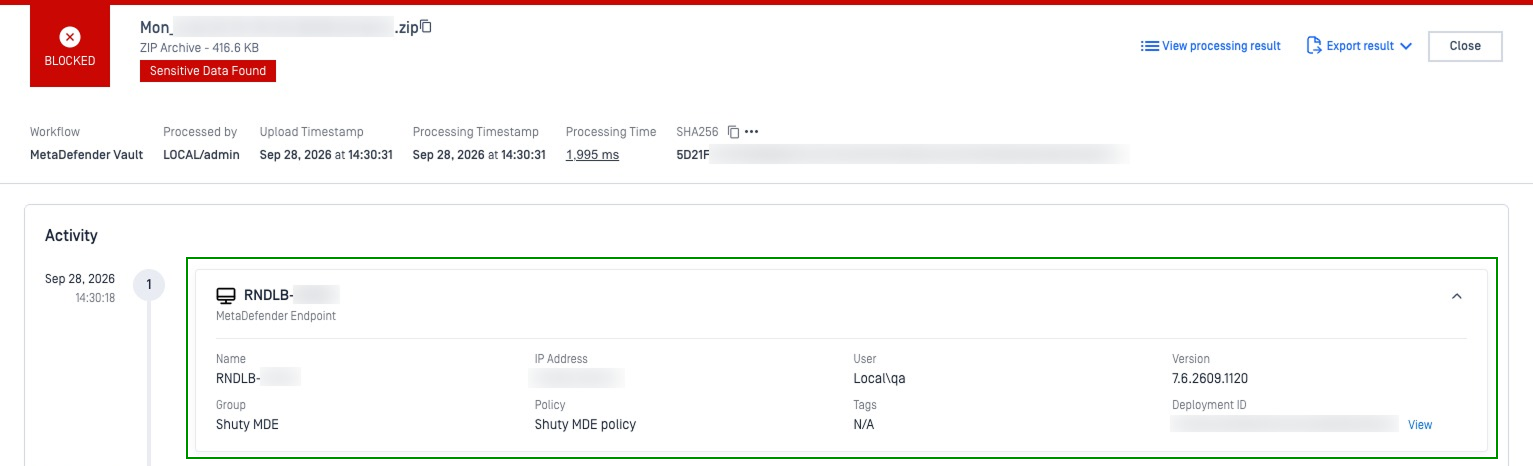 |
Check for scan results and processing information | Scan Details: Workflow type, request method, duration, multi-scan result, and file type verification 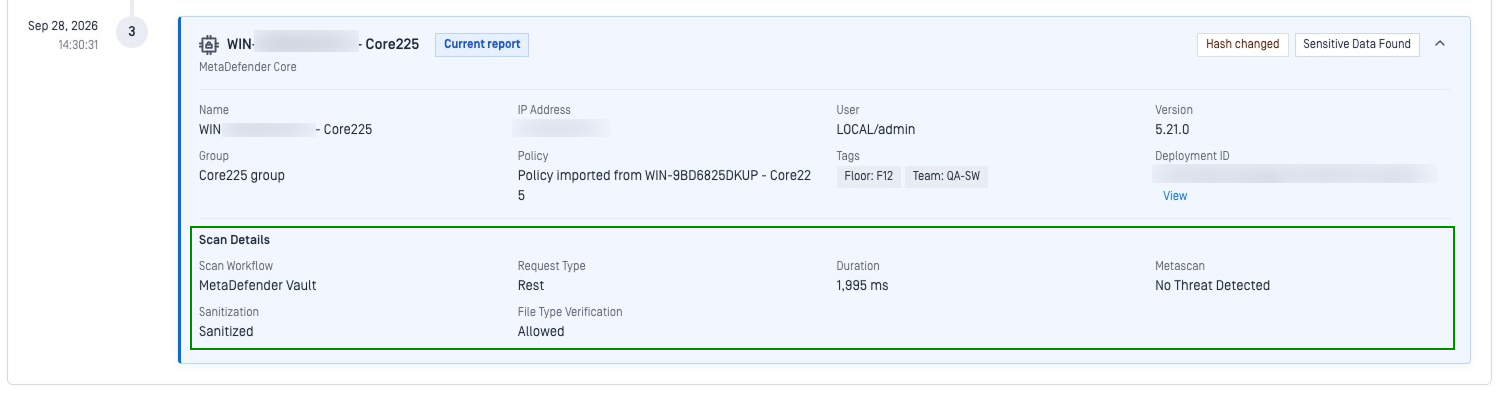 |
Look for indicators that explain file modifications | Hash Changed: Appears on the Core step only when Deep CDR sanitized the file 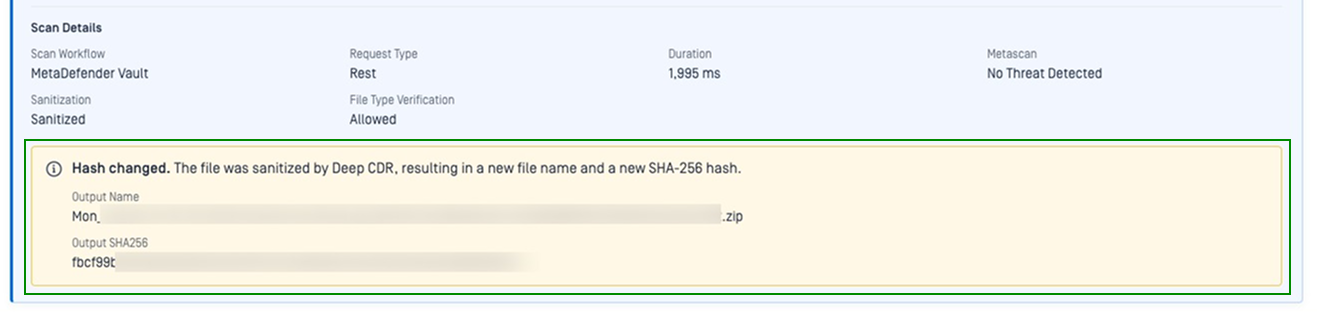 |
Review the scan verdict for each Core pass | Scan Verdict Status Badges: Shows the final verdict from MetaDefender Core  |
Open the instance behind a step | Deployment ID View link: Opens that instance's inventory page in a new tab. MFT and Core steps show this link on a full journey only  |
Check USB/media source information | Peripheral Media: appears on Kiosk cards only. Shows the scanned media model and media type when a Kiosk session was recorded 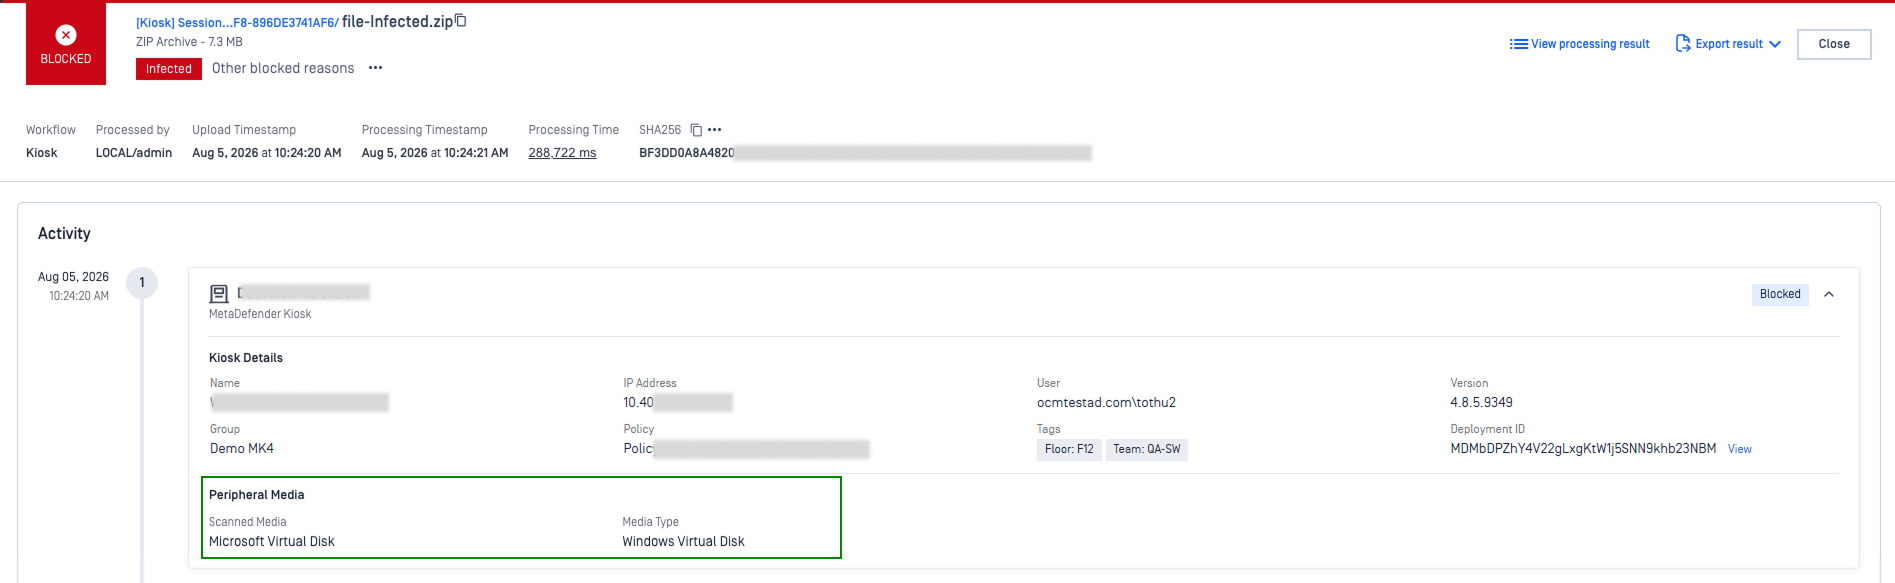 |
Understand multi-hop journeys
A journey lists every hop the file's record reports. Each hop is one of three step types:
Step type | What it shows |
|---|---|
Originating product (Kiosk, Endpoint, or Drive) | The product that first captured the file, with its media info, user, and policy |
MetaDefender Core scan | Its own verdict for that pass. A journey can include more than one Core scan |
MetaDefender Managed File Transfer (MFT) relay | Product identity and a Deployment ID View link. MFT forwards the file and has no scan verdict of its own. A journey can include more than one MFT relay |
File Journey Example
Common journey patterns include:
Example flow | What happened |
|---|---|
Kiosk → Core → MFT → Core | Captured at a Kiosk, scanned by its local Core, relayed through MFT, then scanned again by a second Core |
Endpoint → Core → MFT → Core | Same path, starting from a MetaDefender Endpoint scan |
Drive → Core → MFT → Core | Same path, starting from a MetaDefender Drive scan |
MFT → Core → MFT → Core | A file relayed through two MFT and Core pairs in sequence. No originating product step appears |
Please Note These are examples, not a complete list. A journey can be longer or shorter depending on how many times the file was relayed and rescanned.
Read step order from the timestamps, not the position on screen. Steps appear in the order they were reported and are not re-sorted by time. On journeys with two MFT and two Core steps, steps of the same type can occasionally appear grouped together instead of in the true sequence.
Full vs. Simpler Audit Trail
Not every record shows the same level of detail:
Record type | What you see |
|---|---|
Full audit trail (new records) | Every product the file passed through, including each separate Core scan, plus the Duration Timeline |
Simpler audit trail (older records, or records whose journey could not be resolved) | The products listed on the record, with one Core step at the end, and no Duration Timeline |
Tip Nothing on screen labels which type you are viewing. If the Duration Timeline is missing, you are looking at the simpler trail
Read the Duration Timeline

Below the Activity section, the Duration Timeline shows one bar per step, in the same order as Activity, followed by a Total Duration row. Use it to see which step took the most processing time.
Example for a Kiosk → Core → MFT → Core journey:
Step | Instance | Duration |
|---|---|---|
1 | Kiosk121 | 47 ms |
2 | Core121 | 13,891 ms |
3 | MFT225 | 112 ms |
4 | Core225 | 263 ms |
Total Duration | 14,313 ms |
Keep these rules in mind when reading the chart:
What you see | What it means |
|---|---|
Bar length | Each step's share of total processing time, not when the step started. Bars sit end to end |
Gaps between steps | Not shown. Waiting, queuing, and transfer time between products does not appear on the chart |
Total Duration | The sum of each step's processing time, not total elapsed time. To see real elapsed time, compare the first and last timestamps in the Activity timeline |
A very short MFT duration | Expected. MFT forwards the file and does not scan it |
| No duration was reported for that step. This is normal |
| The reported duration could not be read. |
Special Cases
What you might see | What it means |
|---|---|
Only 2 steps in the timeline | On the simpler trail, the file was handled by one product before reaching Core. This is normal for simple workflows |
A single Core card with no timestamp | The file was processed directly by Core without passing through another product first |
A message saying "No client identity was recorded" | The system couldn't determine which product originally handled the file. The record exists, but the trail can't be reconstructed |
A sanitized file doesn't link back to the original | Each submission creates its own independent trail. If a file was sanitized and then re-submitted, it appears as a separate record with a fresh timeline |
A later Core step shows a verdict that doesn't match the file you opened | Files processed together in the same session or batch (for example, everything scanned from one USB insertion) share the identifier used to connect steps. That step's result may come from another file in the same batch. Treat the journey as strong evidence of the path the batch took, not a guaranteed trace of one file |
Known Limitation
Situation | What to expect |
|---|---|
Scan details on journeys with more than one Core step | Only the final verdict from Core is displayed. Individual scan results from earlier products in the chain are not shown separately |
Step order on journeys with two MFT and two Core steps | Steps may occasionally appear out of sequence. Use the timestamps to confirm the actual order |
Batch-level correlation | Files from the same session or batch share a correlating identifier, so a later step can reflect another file in that batch |
Deployment ID View link | Not available for MetaDefender Endpoint steps. MFT and Core steps show the link on a full journey only |
Media info on every Kiosk card | USB/media details only appear if a Kiosk scan session was recorded. Some Kiosk models (e.g., MK5) don't report this yet |
Older records | Show the simpler trail with one Core step and no Duration Timeline. Existing records are not backfilled |