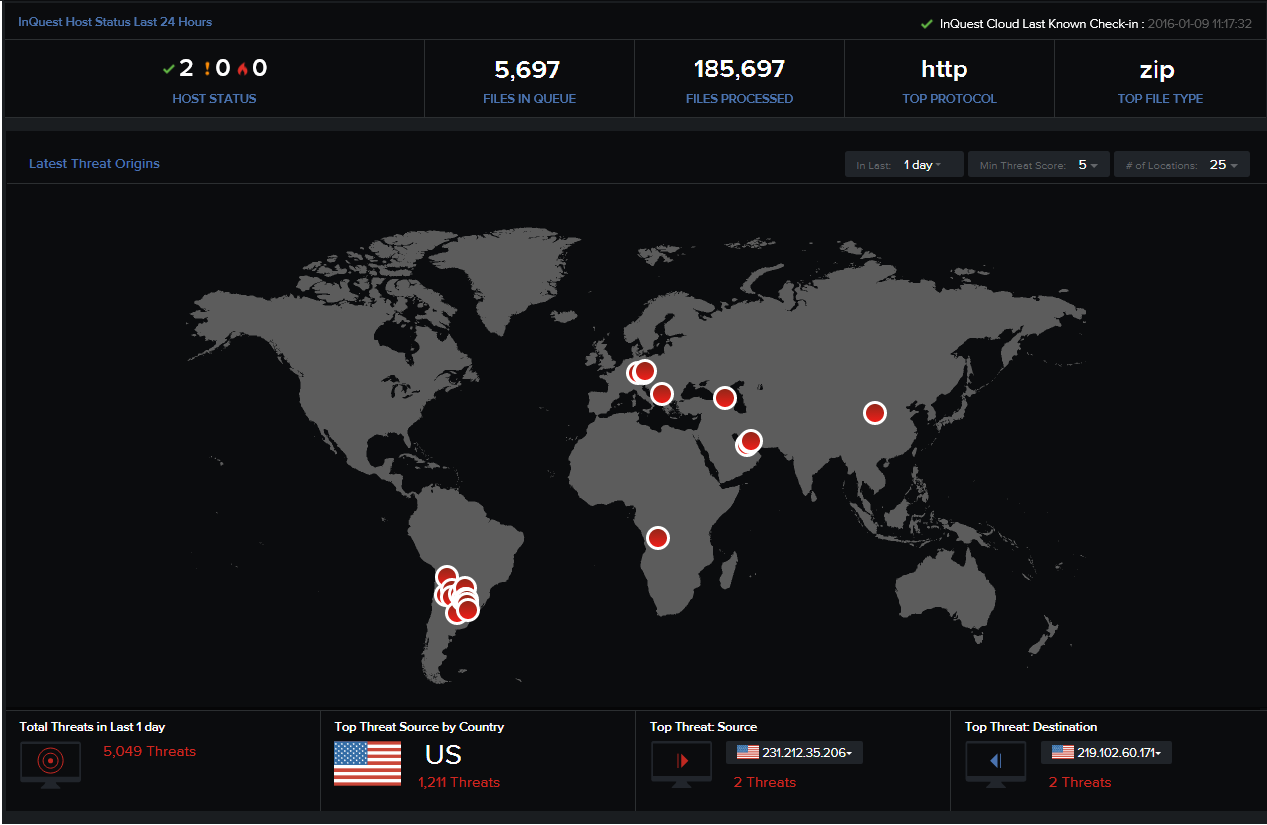
Dashboard provides information about throughput, file processing, and threat analysis of the manager and collectors. It displays events and threats detected in the last 24 hours. Host Status displays the number of files queued and processed while being transferred through the top network protocol (HTTP or SMTP), and the top file type processed by MetaDefender NDR .
Latest Threat Origins
The World map displays red nodes representing the source IP locations of the latest threats. For a selected timeframe, threat score, and the number of locations specified in the drop-down menu, you can view the total number of threats, country listed as the top threat source, source and destination IP addresses of the top threats and their respective number of threats. Tip: Hover over a node to view a tooltip text of the format AU: HTTP / SMTP : 5 / 0. It indicates AU is the country code for Australia and 5 threats are originating from or targeting Australia via the HTTP protocol.
Click on a red node to view its connected white nodes representing the destination IP locations of the threats. Note: By default, data on the World map automatically refreshes every 2 minutes. To manually refresh data, single-click in the map area.
Latest Events
Number of events pertaining to threats, Data-loss, command and control IP addresses, and DNS resolutions in the last 24 hours are listed in graphical form.
Tip: Hover over a node at a particular instance. A tooltip displays the number of events that occurred at that instance.
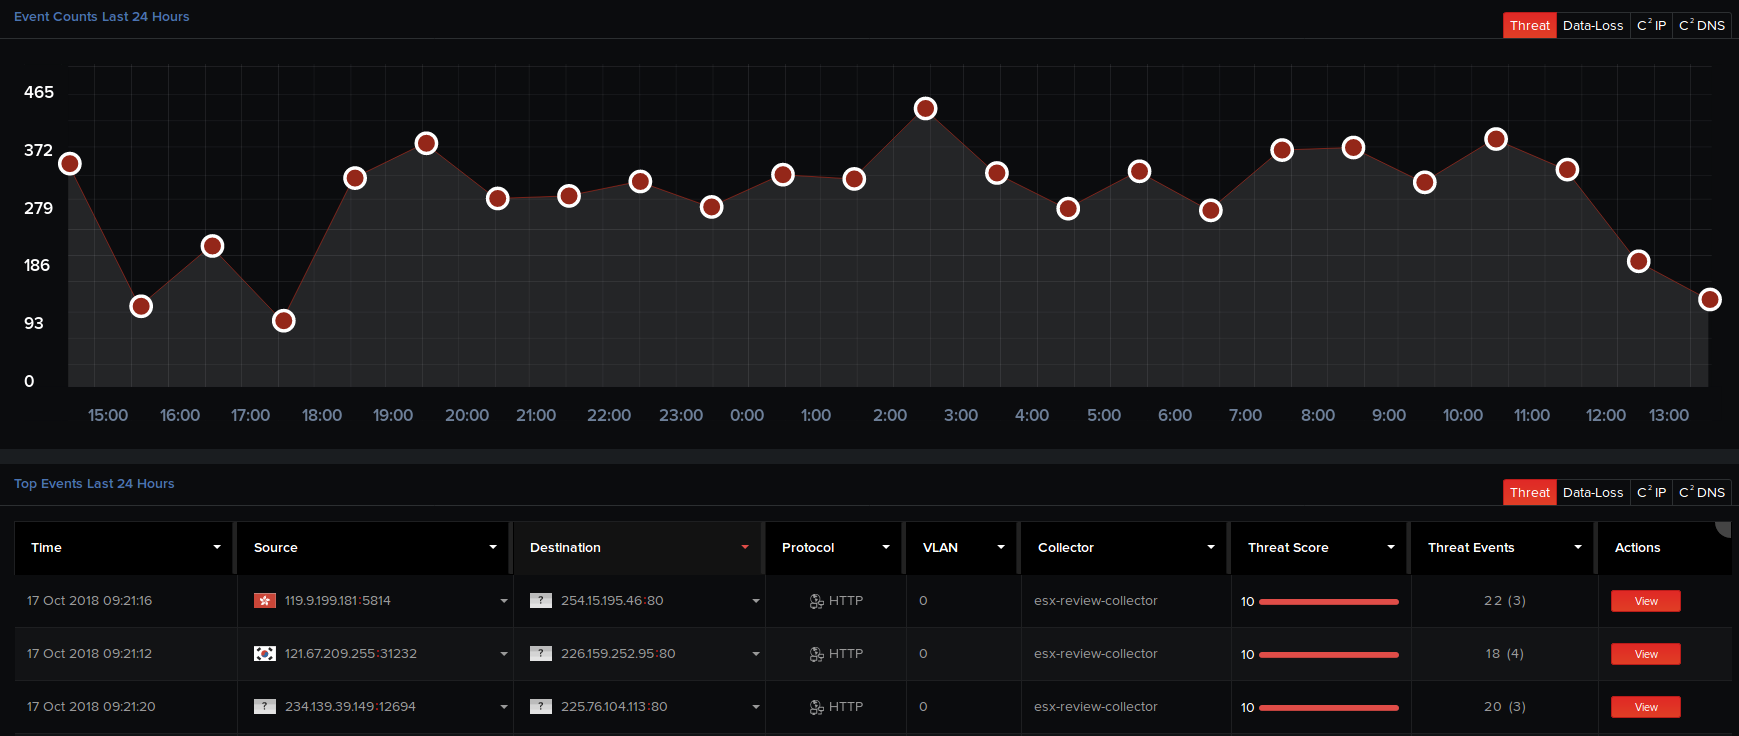
Furthermore, you can view the basic details of the top 10 events detected in the last 24 hours in a tabular form. On the Threat tab, click View corresponding to a threat to view its detailed analysis report on the Analysis page. On the C2 IP and C2 DNS tabs, click View to view detailed reports on the IP connections and DNS lookups respectively.
For a selected tab, click View All at the bottom of the page to view all its top events detected in the last 24 hours on the Analysis page.
Tips:
- Hover over the grey area at the top-right edge of this table header, then click the required tabular columns to hide them from the table. A drop-down menu appears listing all the tabular column header names. Click on the


- Click on any column in the table header to arrange and display the column items in a particular sequence (alphabetical, ascending, or descending order).