The MetaDefender Software Supply Chain dashboard gives you an overview of the security posture of all your scanned repositories: overall risk indicators, the vulnerabilities that were found, the riskiest packages and repositories, how vulnerabilities evolve over time, and actionable security suggestions.
Use the two filters in the upper-right corner to scope all of the dashboard data: the connection filter (All Connections by default) limits the data to a single connection, and the time-range filter switches between Last 24 hours, Last 7 days, Last 30 days, and All time.
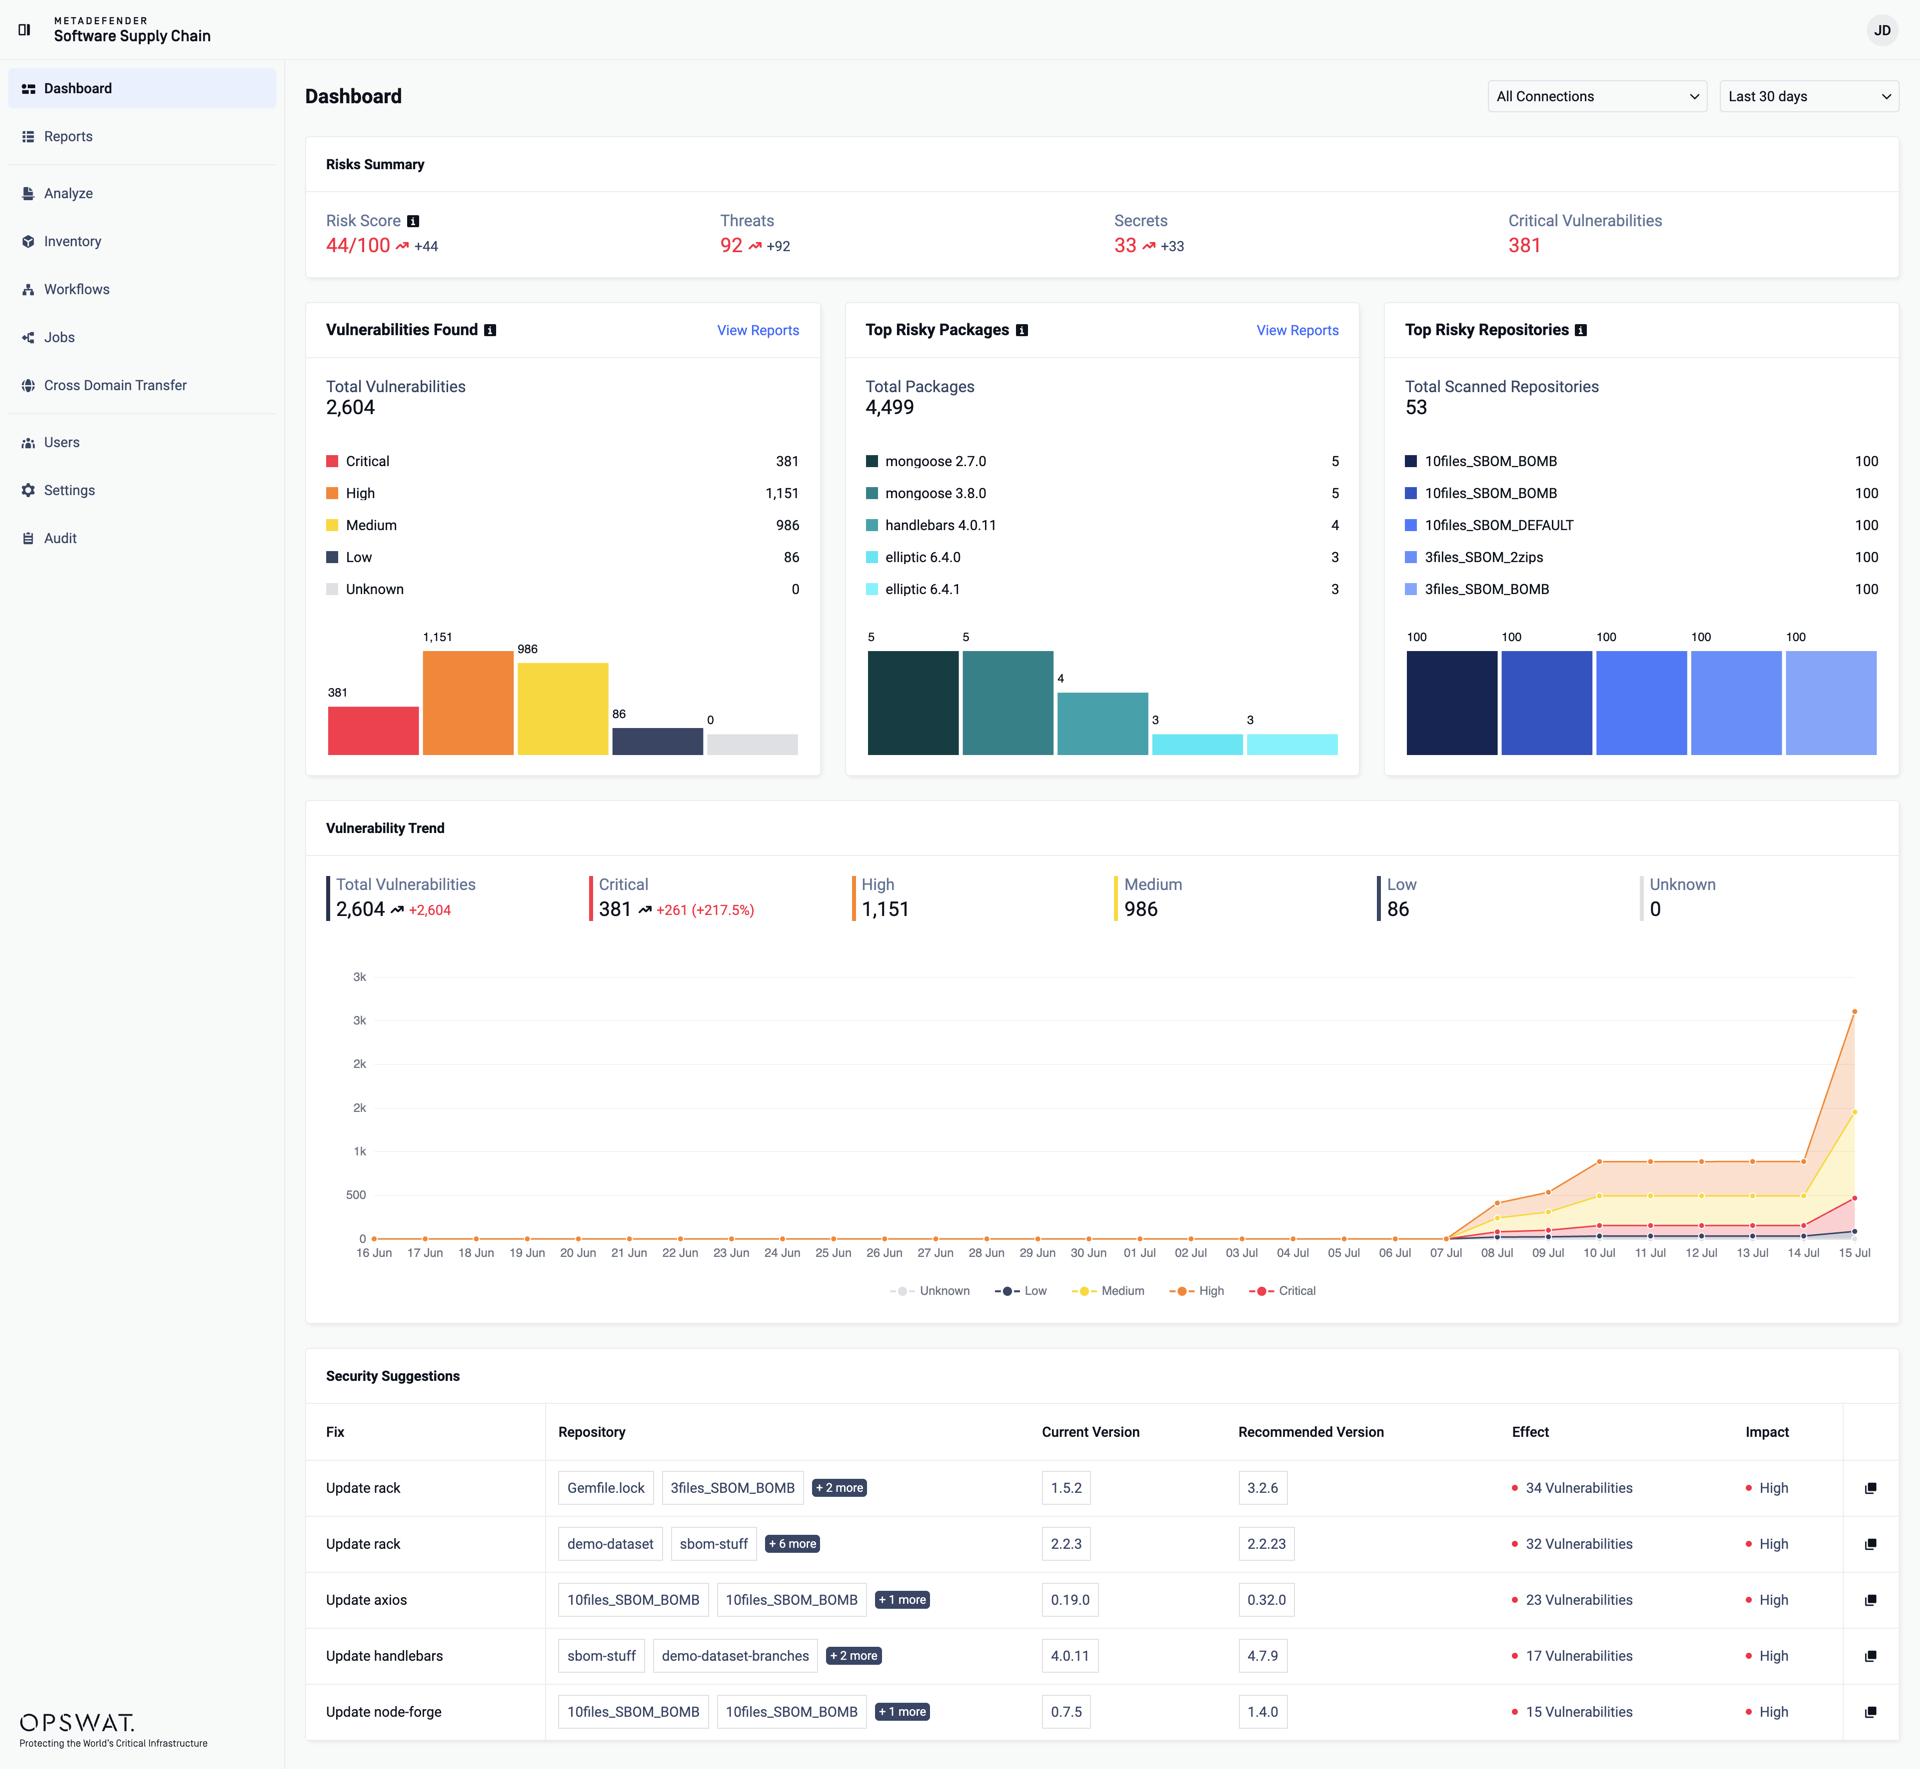
Risks Summary
The Risks Summary card shows four key security indicators:
Risk Score: the average of the risk scores across all scanned repositories, on a 0-100 scale, where 0 means clean.
Threats: the number of detected threats.
Secrets: the number of detected secrets, such as credentials or tokens committed to the code.
Critical Vulnerabilities: the number of vulnerabilities with Critical severity.

The arrow next to a value indicates its trend within the selected time range: a red rising arrow means the value increased, while a green falling arrow means it improved.
Vulnerabilities and Top Risks
Three cards provide a breakdown of what was found across your repositories:
Vulnerabilities Found: the total number of vulnerabilities, categorized by severity: Critical, High, Medium, Low, and Unknown.
Top Risky Packages: the packages with the highest risk. The number next to each package is the number of critical vulnerabilities found in it.
Top Risky Repositories: the scanned repositories with the highest risk scores, on a 0-100 scale.
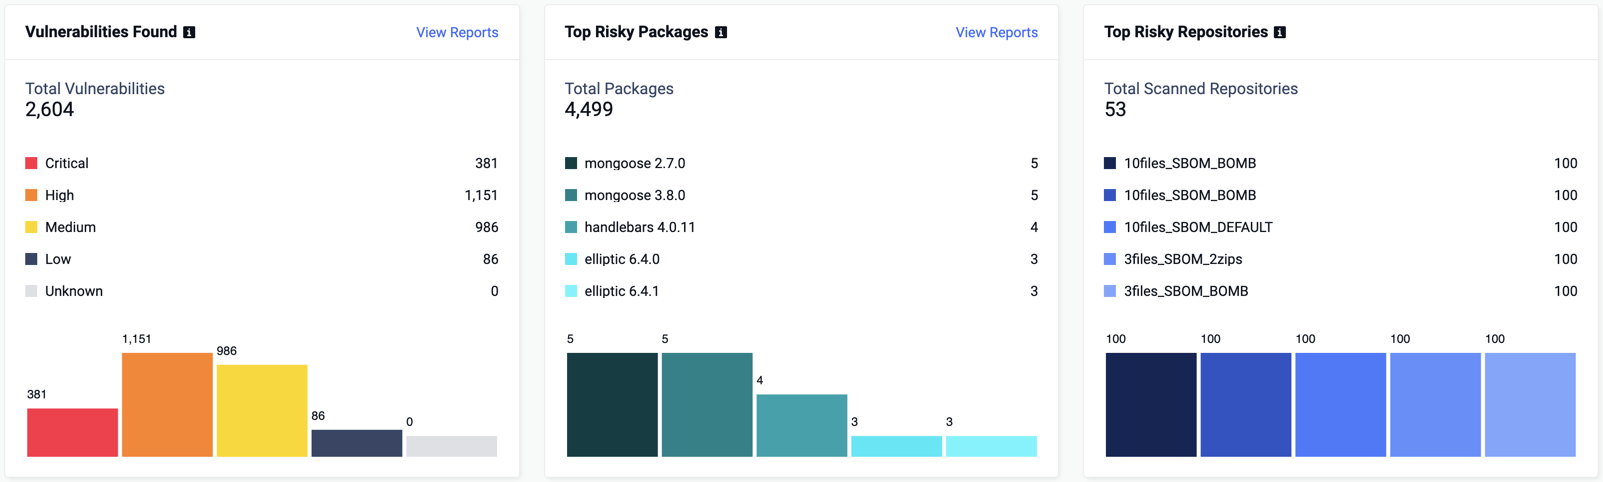
Use the View Reports links in the corner of the cards to open the Reports page pre-filtered to the corresponding data.
Vulnerability Trend
The Vulnerability Trend chart provides a visual representation of how vulnerabilities evolve across your environment over the selected time range. The summary above the chart shows the current totals for each severity level, together with their trends. By tracking changes in vulnerability counts, you can identify patterns, monitor remediation progress, and detect emerging threats.
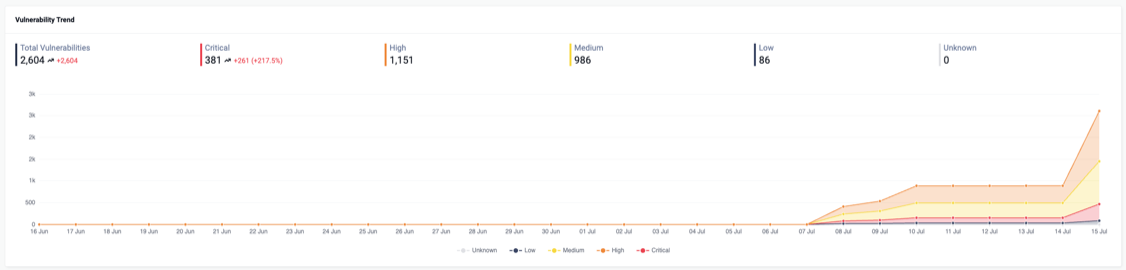
The chart is interactive: hover over any data point to reveal a tooltip with the exact vulnerability counts for that period, and click the legend items below the chart to toggle the visibility of individual severity levels for a focused comparison.
Security Suggestions
The Security Suggestions table lists the most impactful package updates you can make, based on the top risky packages found in your repositories:
Fix: the suggested action, for example updating a package to a newer version.
Repository: the repositories where the package was found.
Current Version and Recommended Version: the detected version and the version that resolves the issues.
Effect: the number of vulnerabilities that the update would fix.
Impact: the severity of the improvement.
Use the copy button at the end of a row to copy the update command to your clipboard, or click the row to open the package details.