
My OPSWAT Central Management can send diagnostic data, a fixed set of infrastructure health measurements, from your on-premises appliance to OPSWAT.
Diagnostic data contains only numeric measurements. It never includes file contents, file names, scan results, or any customer data processed by the product.
On This Page
Why Enable Diagnostic Data?
Diagnostic data gives OPSWAT visibility into your appliance's health. That benefits you in several ways:
Faster support: When you open a ticket, we can already see how your appliance is running, so you spend less time reproducing the issue and collecting logs.
Better product quality and fewer issues over time: Health data from real deployments helps OPSWAT catch problems, such as a resource leak on a specific OS version, and fix them in a future release before they affect you.
Supported Form Factors
Diagnostic data is available on the following form factor:
Form factor | Operating system | Diagnostic data |
|---|---|---|
MSI installer | Windows | Supported |
RPM package | Linux | Supported |
OVA virtual appliance | Linux | Supported |
The same fixed metric set applies to every form factor; a measurement that does not apply to an operating system (for example, load average on Windows) is simply omitted.
Version requirement
Diagnostic data is available in My OPSWAT Central Management 10.7.26080 and later. On earlier versions the feature is not visible and the Diagnostic Data tab does not appear under Settings → Servers.
Diagnostic data is strictly opt-in. Until an administrator enables it, the appliance neither collects nor transmits any of the measurements described on this page. If the diagnostic data is invalid, transmission is blocked and no data is sent.
What Data is Collected?
When diagnostic data is enabled, a lightweight agent collects the following set of appliance health and performance metrics every 30 seconds.
The metric categories are summarized below. For security and compliance reviews, a complete list of collected metrics is also available below.
Category | What it measures |
|---|---|
System | How long the appliance has been running; the total number of running processes |
Processors | CPU busy percentage; number of logical processors; load average (Linux only) |
Memory | RAM in use and free, and the machine's total RAM |
Pagefile / swap | Pagefile or swap capacity, how much is in use, and paging activity |
Disk space | Capacity, used space, and percentage full. One row per fixed disk, under neutral names |
Disk activity | Total bytes and operations read/written across the host's disks |
Network | Total bytes, packets, dropped packets, and errors across the host's network interfaces; TCP connection counts by state |
My OPSWAT Central Management services | For My OPSWAT Central Management's own services only: whether each service is running and listening on its port, and its CPU, memory, and thread usage |
Telemetry self-health | Whether the diagnostic data itself is fresh, and bounded counters of collection errors |
System
Metric | What it measures | Availability |
|---|---|---|
| Time since the appliance last started | Windows & Linux |
| Total number of running processes | Windows & Linux |
Processors
Metric | What it measures | Availability |
|---|---|---|
| Fraction of CPU time in use | Windows & Linux |
| Number of logical processors | Windows & Linux |
| One-minute load average | Linux only |
| Five-minute load average | Linux only |
| Fifteen-minute load average | Linux only |
Memory
Metric | What it measures | Availability |
|---|---|---|
| RAM bytes in use and free | Windows & Linux |
| Fraction of RAM in use and free | Windows & Linux |
| Total RAM | Windows & Linux |
Pagefile / swap
Metric | What it measures | Availability |
|---|---|---|
| Pagefile/swap bytes in use and free | Windows & Linux |
| Fraction of pagefile/swap in use and free | Windows & Linux |
| Cumulative page-in and page-out operations | Windows & Linux |
| Cumulative page faults | Windows & Linux |
Disk space
Metric | What it measures | Availability |
|---|---|---|
| Bytes used and free per fixed disk | Windows & Linux |
| Capacity per fixed disk | Windows & Linux |
| Fraction used and free per fixed disk | Windows & Linux |
Disk activity
Metric | What it measures | Availability |
|---|---|---|
| Cumulative bytes read and written (host total) | Windows & Linux |
| Cumulative read and write operations (host total) | Windows & Linux |
| Cumulative time disks spent doing I/O (host total) | Windows & Linux |
| Cumulative time spent on read/write operations (host total) | Windows & Linux |
Network
Metric | What it measures | Availability |
|---|---|---|
| Cumulative bytes sent and received (host total) | Windows & Linux |
| Cumulative packets sent and received (host total) | Windows & Linux |
| Cumulative dropped packets (host total) | Windows & Linux |
| Cumulative send/receive errors (host total) | Windows & Linux |
| TCP connections by state (for example | Windows & Linux |
MOCM services — each value identifies only the MOCM service it belongs to, by its fixed product name
Metric | What it measures | Availability |
|---|---|---|
| Whether the service is running and listening on its port (1/0) | Windows & Linux |
| Number of running processes for the service | Windows & Linux |
| Number of processes the product expects for the service | Windows & Linux |
| The service's share of host CPU | Windows & Linux |
| The service's memory in bytes | Windows & Linux |
| The service's share of host memory | Windows & Linux |
| The service's thread count | Windows & Linux |
| Uptime of the service's youngest process | Windows & Linux |
| The service's open Windows handles | Windows only |
| The service's open file descriptors | Linux only |
| The service's cumulative disk I/O bytes | Windows & Linux |
| The service's cumulative page faults | Windows & Linux |
Service probes
Metric | What it measures | Availability |
|---|---|---|
| Result (1/0) of a fixed loopback HTTP health check of an MOCM service | Windows & Linux |
| Result (1/0) of a fixed loopback TCP connect check of an MOCM service | Windows & Linux |
Telemetry self-health
Metric | What it measures | Availability |
|---|---|---|
| Age of the most recent completed collection cycle | Windows & Linux |
| Count of collection failures, by a fixed category (never an error message) | Windows & Linux |
Note Nothing outside this list can leave your appliance. Any metric whose name or attribute is not on the approved list is automatically excluded and not reported. If a value cannot be read, it is omitted entirely rather than reported as zero or a made-up placeholder.
What Data is Never Collected?
The following never leave the appliance, in any field of any measurement:
Host name, host ID, serial numbers, IP or MAC addresses, or cloud instance metadata
Process IDs, command lines, usernames, or executable paths
URLs, endpoints, port numbers, response bodies, or error message text
File contents, file names, scan results, credentials, or tokens
Custom folder paths, disk device identifiers, volume GUIDs, or network interface names
Any customer-entered free text
Disks are reported under neutral names (system, boot, data, vol0…vol7). A disk's location is included only when it carries no customer information: a Windows drive-letter root such as C: or D:, or a standard Linux mount point such as / or /var. A disk mounted at a custom path is reported under a neutral name only, and its path is never transmitted.
How Data is Identified and Transmitted
Measurements are collected and transmitted every 30 seconds. This interval is fixed and cannot be configured. Each transmission contains only the current metric values. No data is stored for later bulk upload.
Each appliance is identified only by its deployment ID, which is already assigned by the product. Nothing is derived from the host's hardware or name.
The operating system edition and version (for example Microsoft Windows Server 2022 Standard) are included to help OPSWAT troubleshoot compatibility issues. This information is read directly from the operating system. If a value cannot be retrieved, it is omitted rather than estimated.
Data is transmitted over TLS to OPSWAT. If the appliance is configured to use a forward proxy, diagnostic data is transmitted through the same proxy. The destination endpoint is predefined by the product and cannot be modified from the console.
Diagnostic data is sent to activation.dl.opswat.com over TCP 443, the same domain and port already required for license activation (see System Requirements). If your environment already allows license activation traffic, no additional firewall or proxy changes are required for diagnostic data.
Enabling Diagnostic Data
There are two places to opt in:
During a Windows installation or upgrade
At any time from My OPSWAT Central Management console
During Windows Installation or Upgrade
When installing or upgrading on Windows (MSI), you'll see a Diagnostic data page. It appears when you:
Install 10.7.26080 or later for the first time
Upgrade an appliance from a version earlier than 10.7.26080 for the first time
On the Diagnostic Data page:
Select Send diagnostic data to OPSWAT to start sending diagnostic data immediately
Leave the option unchecked to keep diagnostic data disabled (default)
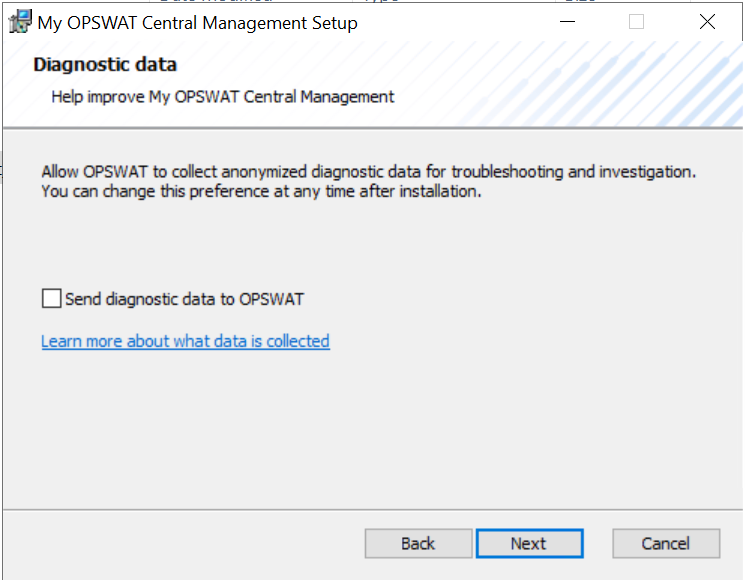
Either choice can be changed at any time after installation from My OPSWAT Central Management console.
Note This option is available only for Windows MSI installations. For RPM and OVA deployments, enable diagnostic data from My OPSWAT Central Management console after the appliance is running.
From My OPSWAT Central Management Console
Log in to My OPSWAT Central Management
Navigate to Settings → Servers
Open the Diagnostic Data tab
Turn on the Send diagnostic data to OPSWAT toggle
Note If the Diagnostic Data tab is not visible, the appliance is running a version earlier than 10.7.26080 and must be upgraded before this feature is available.
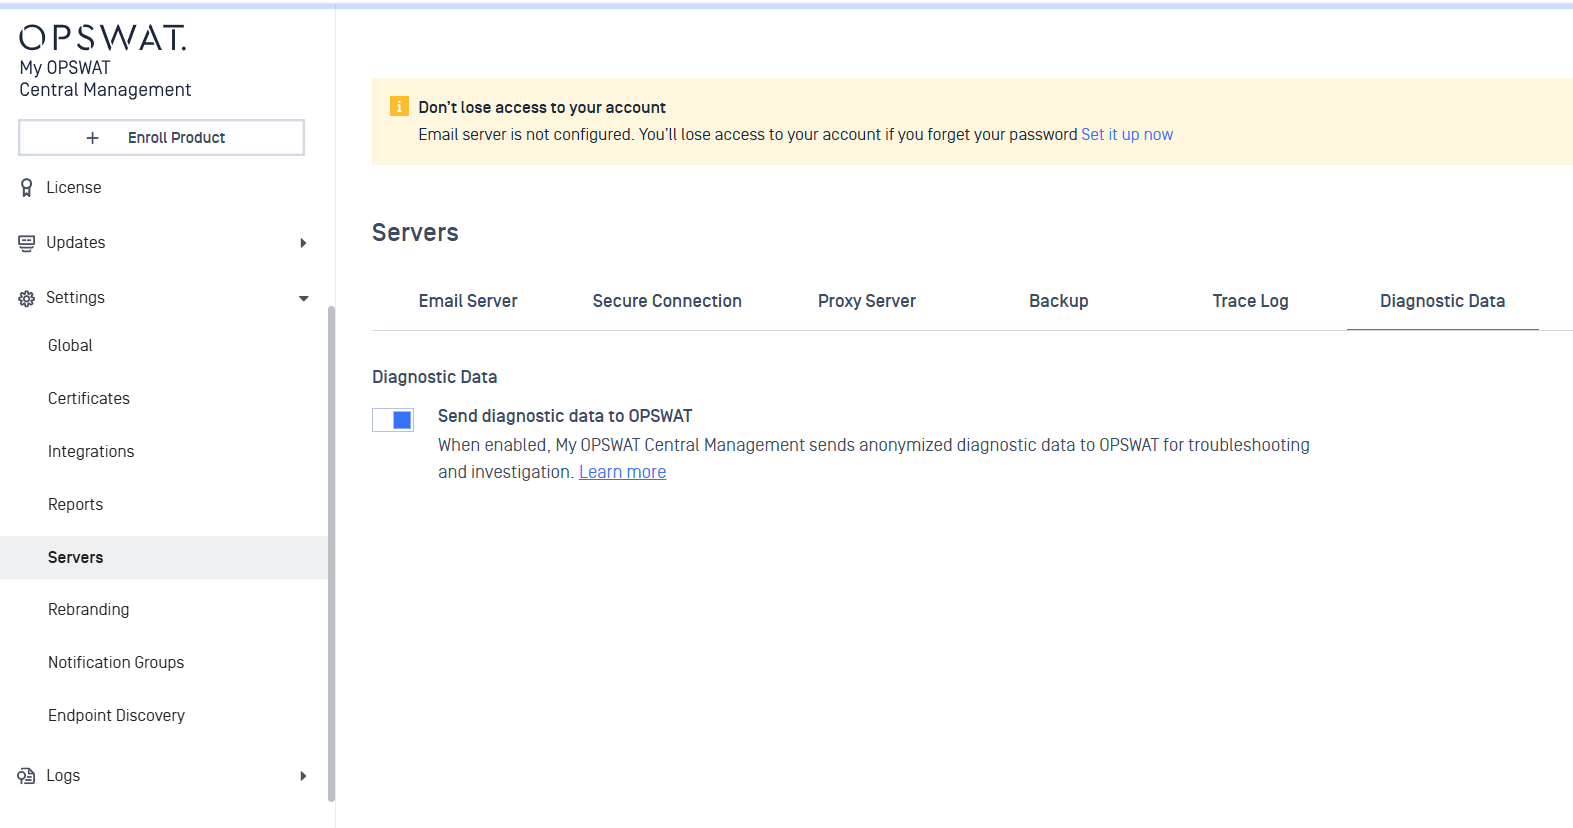
The setting applies immediately. Once the toggle is on, the appliance starts its 30-second collection and transmission cycle; when it is off, the appliance immediately stops collecting and transmitting. No data is queued for later upload.