Function
Track the performance and security posture of the MetaDefender ICAP Server using a time-based selector. This application offers insights into CPU, memory, and disk usage, enabling effective resource management and system health monitoring.
Performance metrics
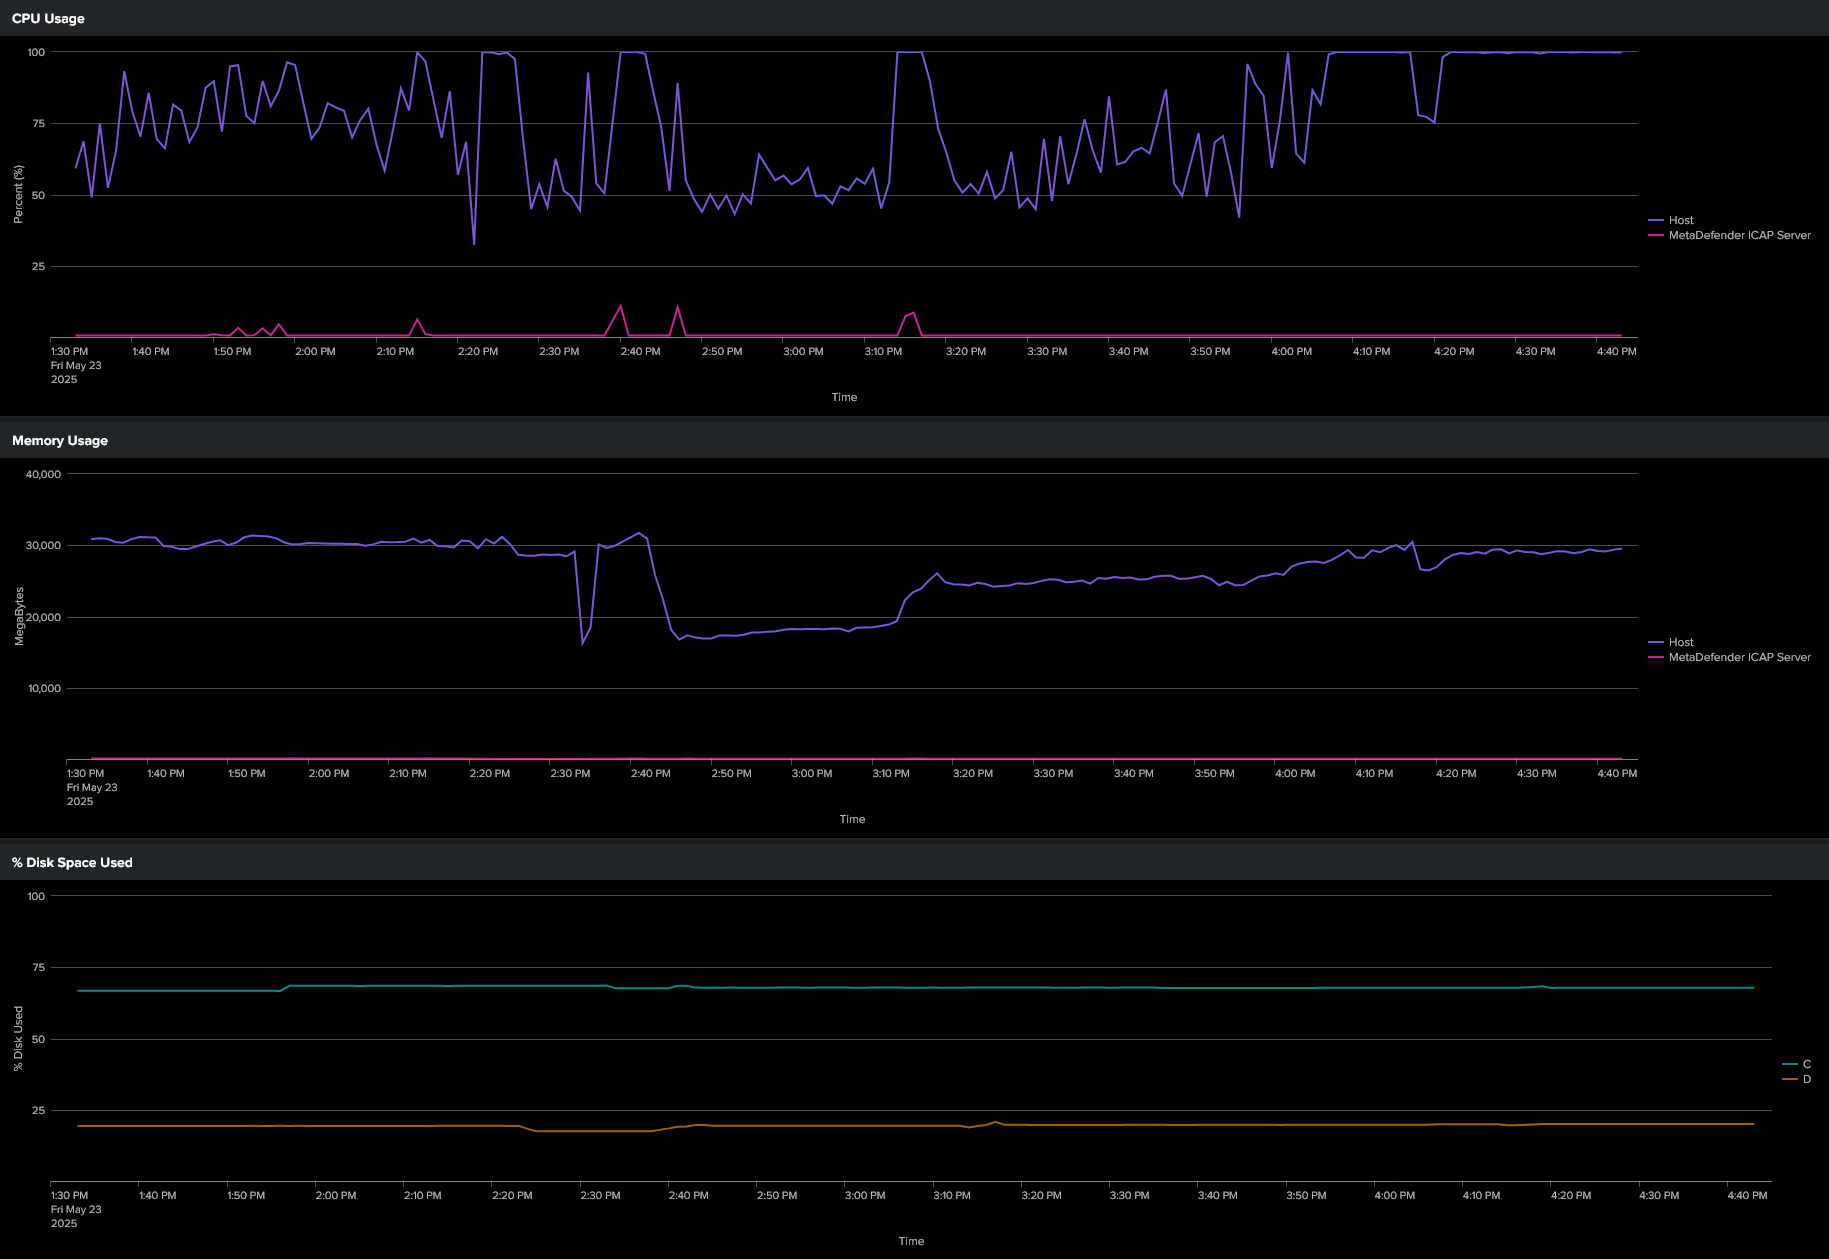
CPU & Memory Usage: Monitor utilization trends over time to detect performance bottlenecks or abnormal behavior.
Disk Space: View disk usage patterns to avoid storage-related interruptions.
Request status
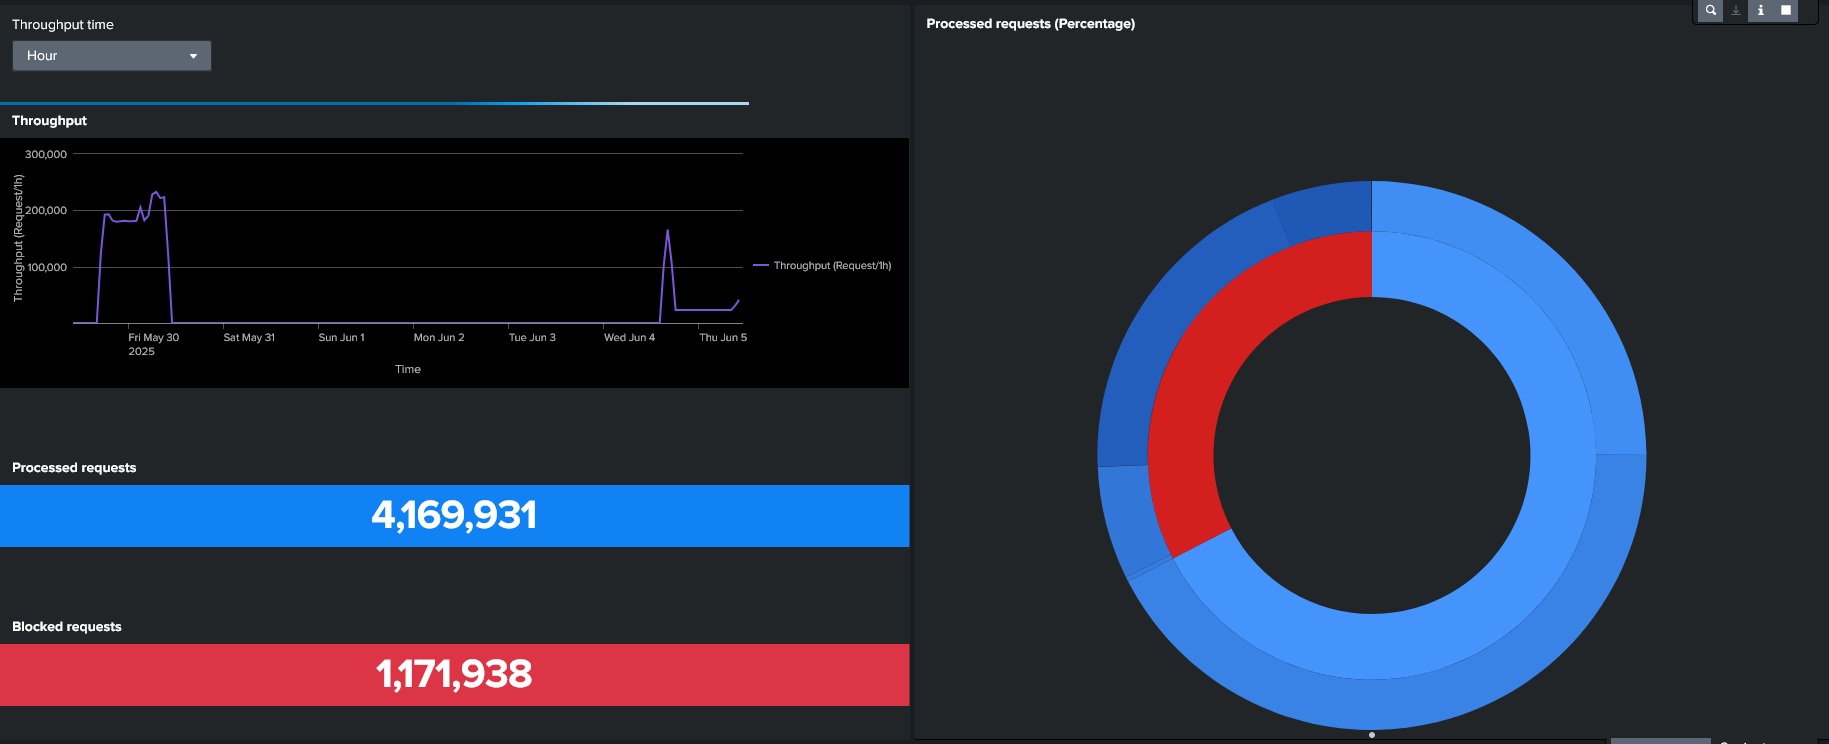
Processed vs Blocked Requests: Visualize request outcomes, identifying how many were blocked due to threats or policy violations.
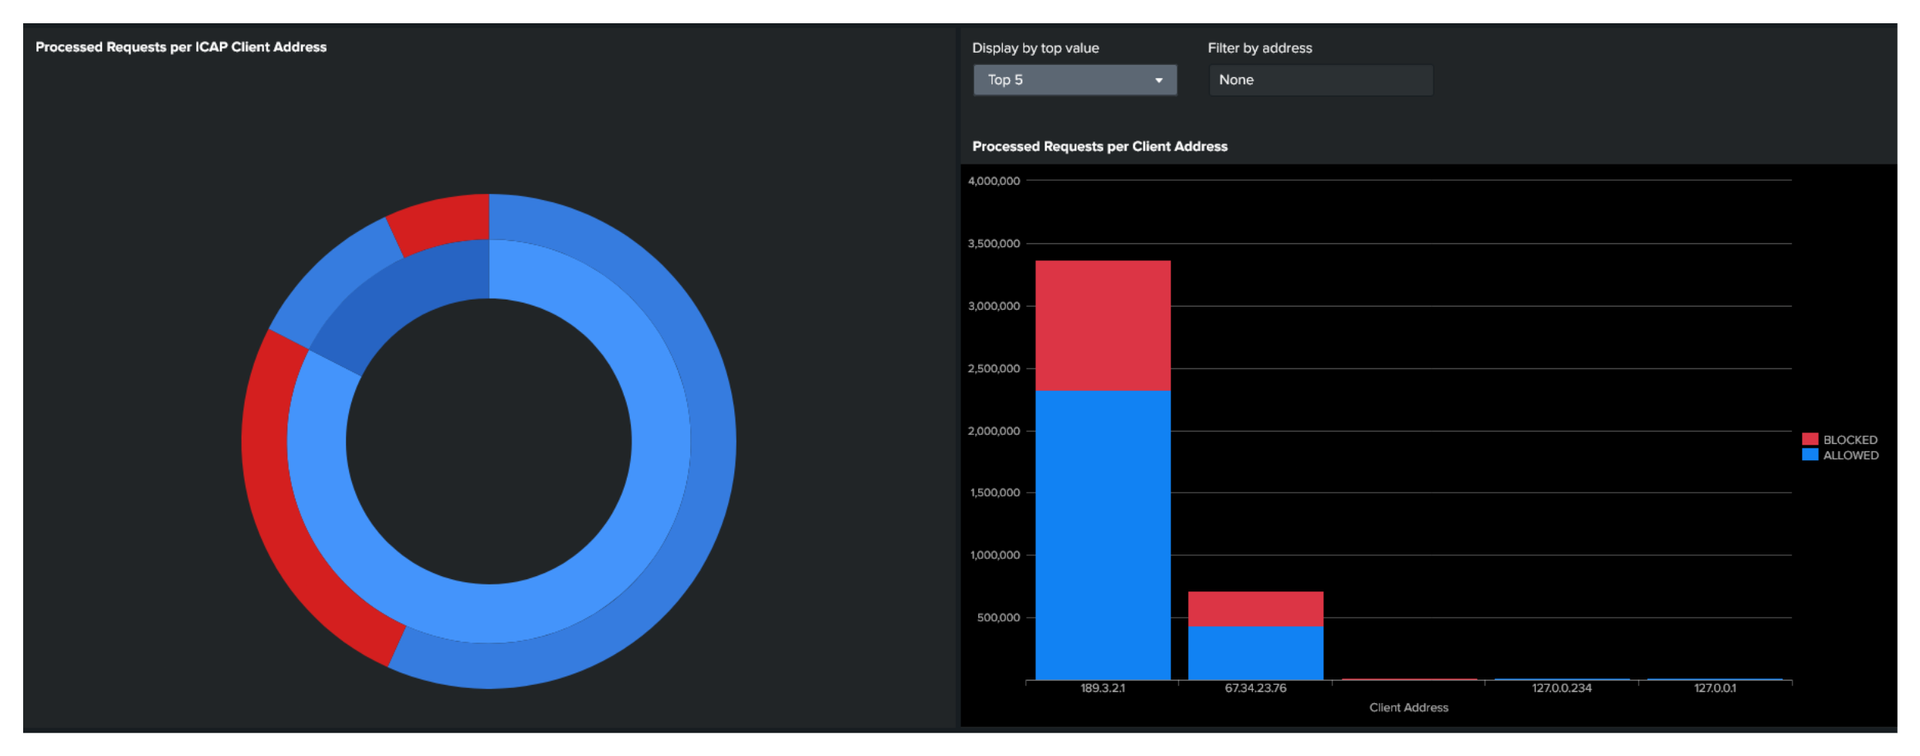
Top ICAP Clients: Identify which IP addresses are generating the most traffic—what’s allowed vs. blocked.
Request Status by Client: Analyze how different clients are interacting with the ICAP server—what’s allowed vs. blocked.
Scan server insights
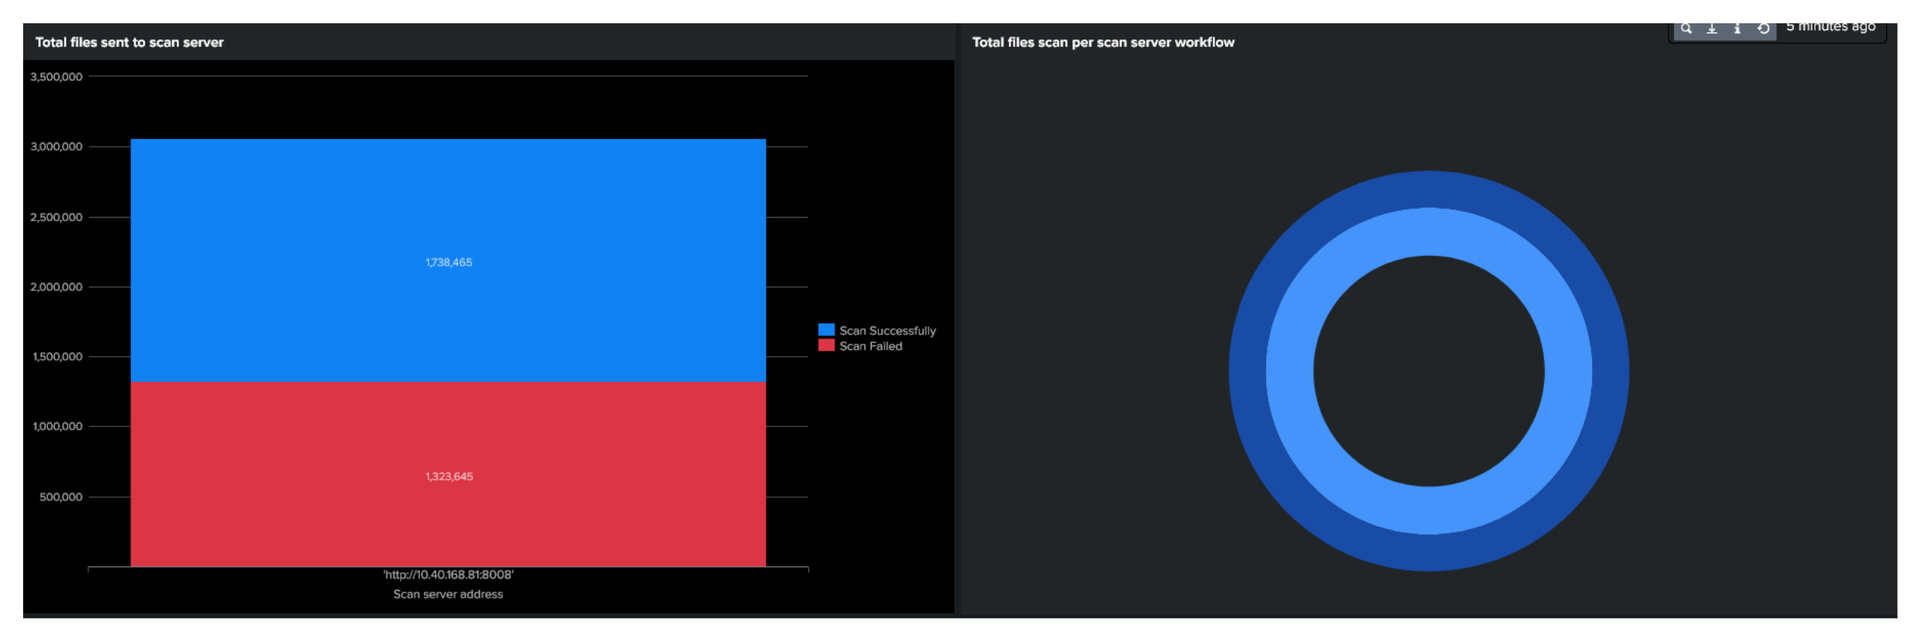
File Scan Results: See how many files were successfully scanned or failed across different scan servers. Additionally, gain clarity on scanning performance by scan server workflow for fine tuning optimization.
Install and Configure MetaDefender File Security App for Splunk
Installation
1. Offline installation
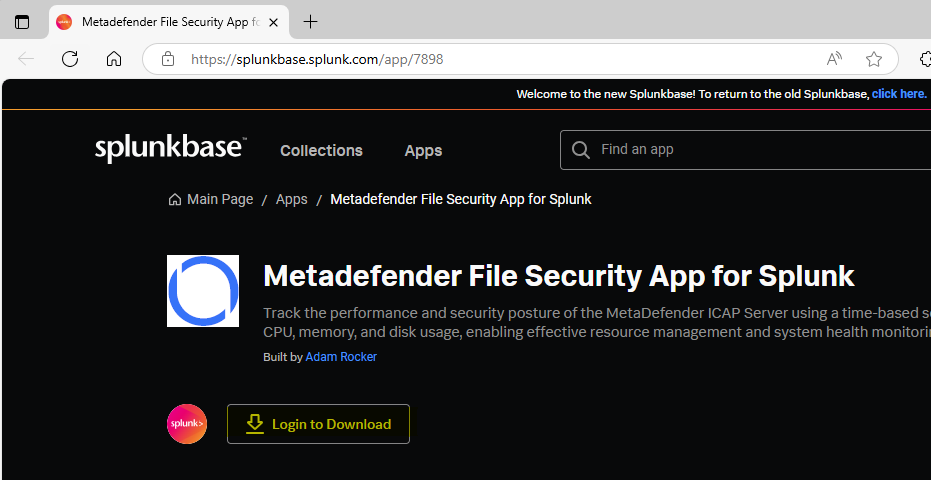
Download the package from Splunkbase: https://splunkbase.splunk.com/app/7898
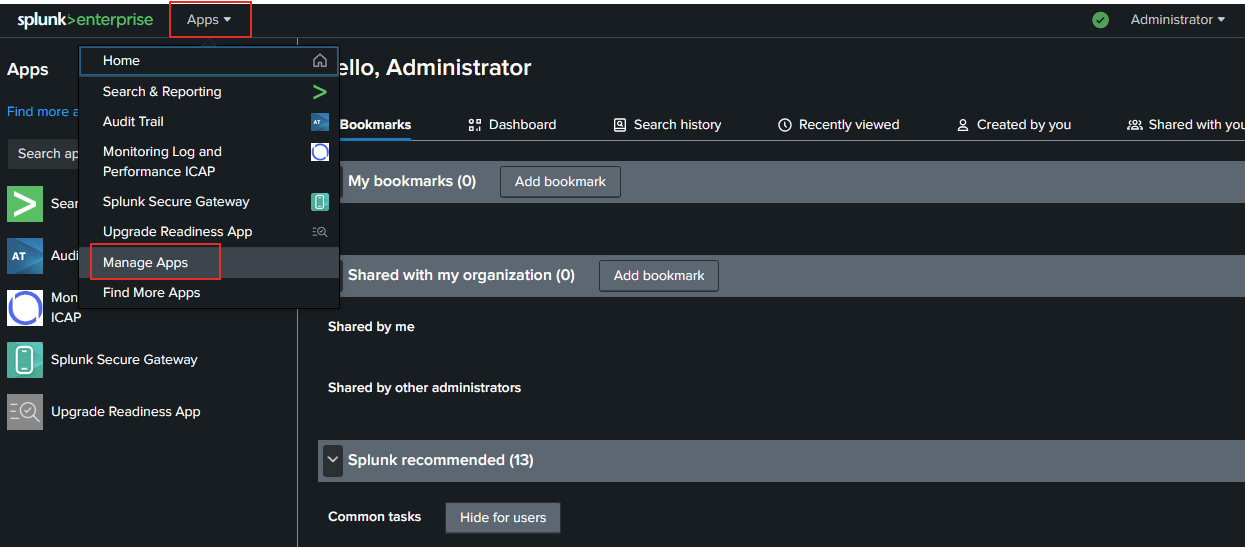
In Splunk Enterprise, go to App → Manage Apps → Install app from file
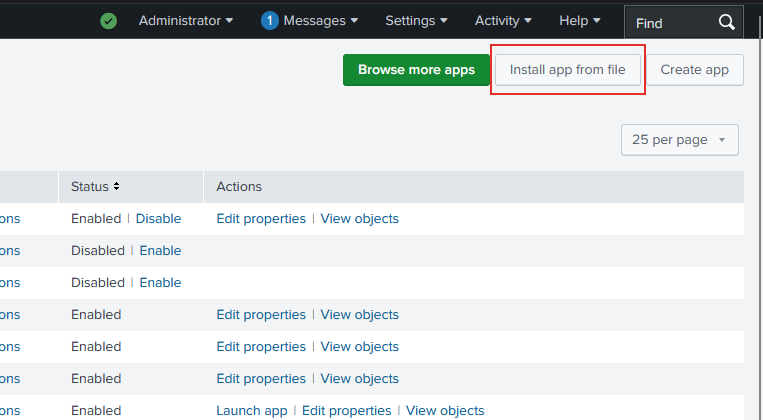
Click Browse to select the Splunk app file
(.spl), then click Upload
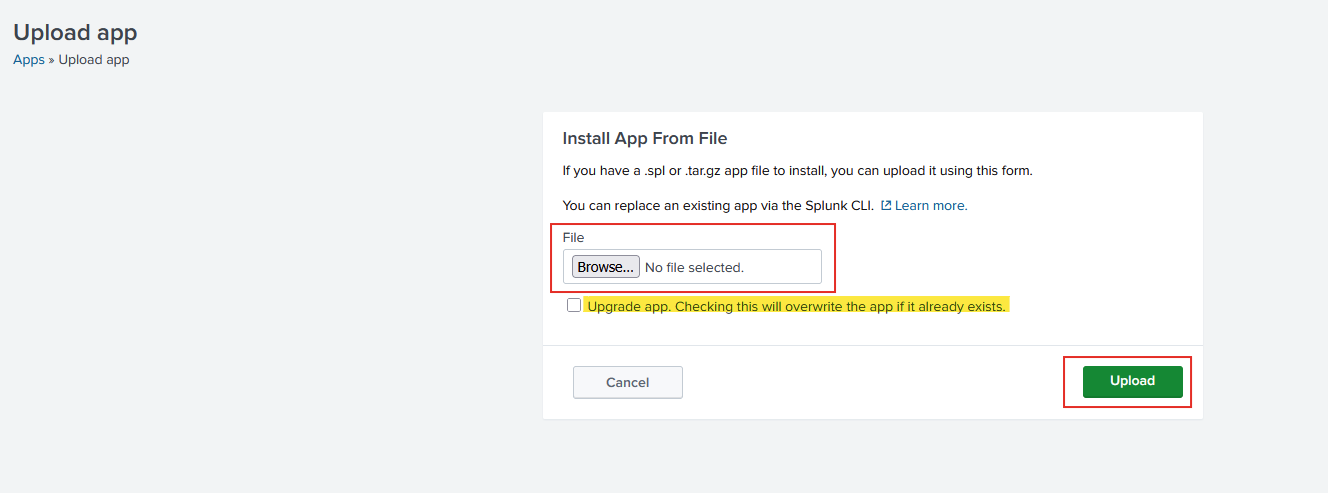
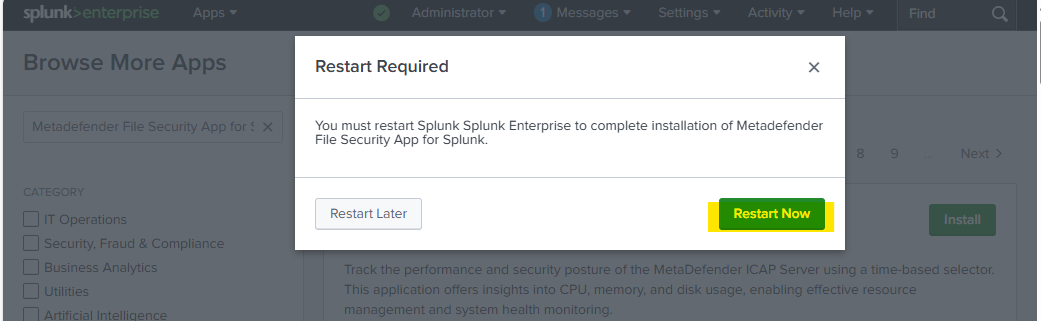
After successfully installing the ICAP Splunk app, restart the Splunk service to apply the changes.
2. Online installation
In the Splunk enterprise UI: go to Apps → Find More Apps
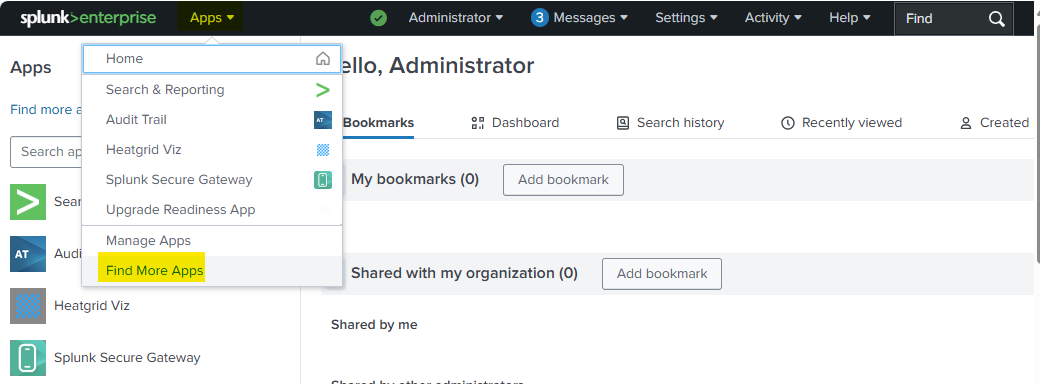
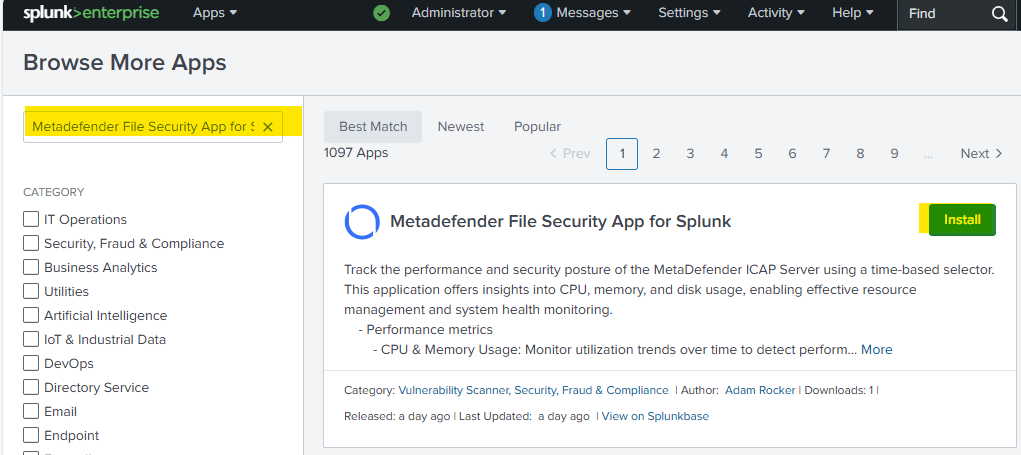
Search for "MetaDefender File Security App for Splunk"
Click Install
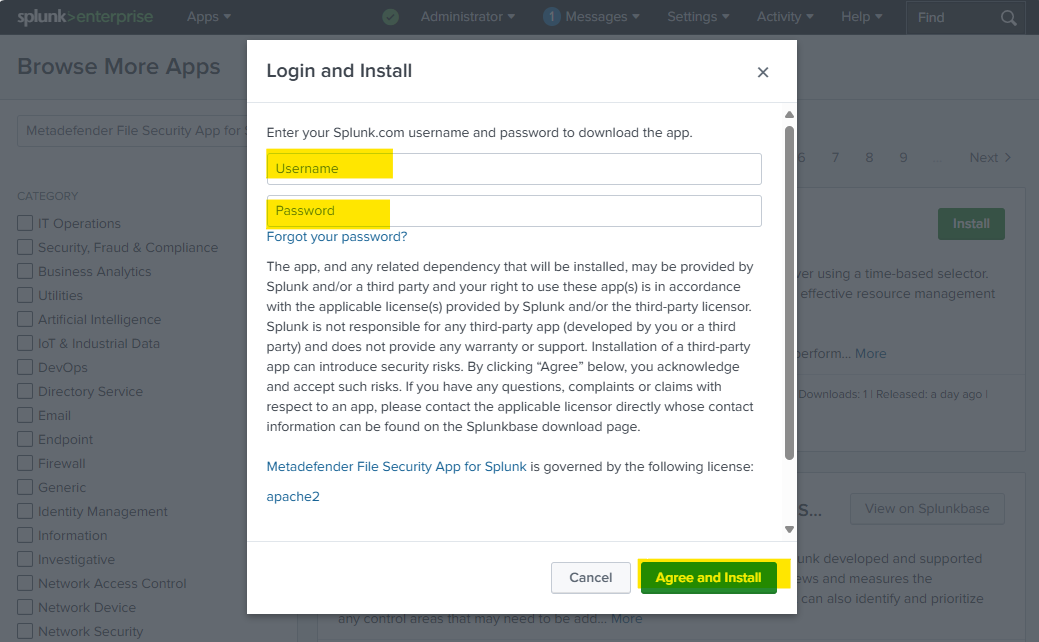
Sign in with your Splunk.com credentials to install
Click Restart Now to restart the Splunk service and complete the installation.
Configure the MetaDefender File Security App for Splunk
Step 1: Configure TCP input in Splunk Enterprise to receive syslog data from MetaDefender ICAP Server and MetaDefender Core.
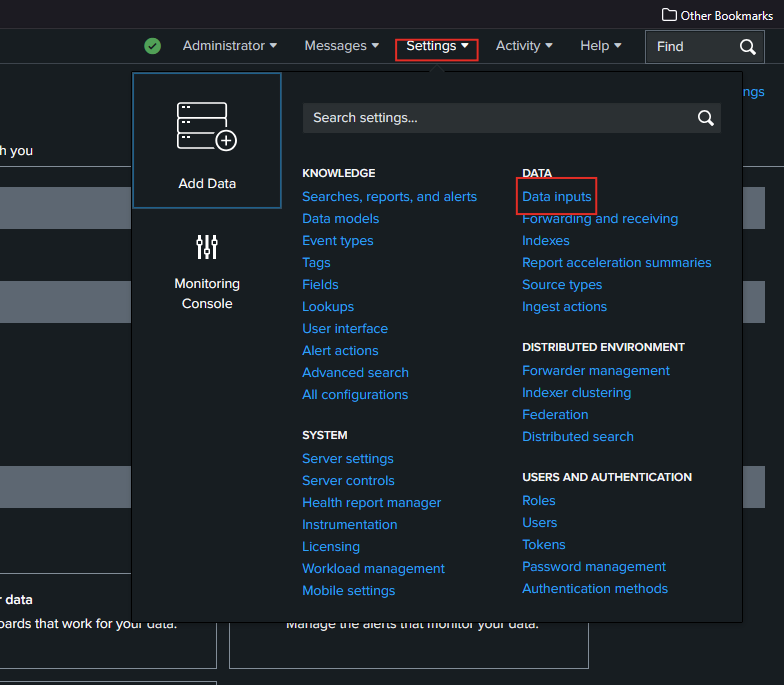
Go to Settings → Data inputs
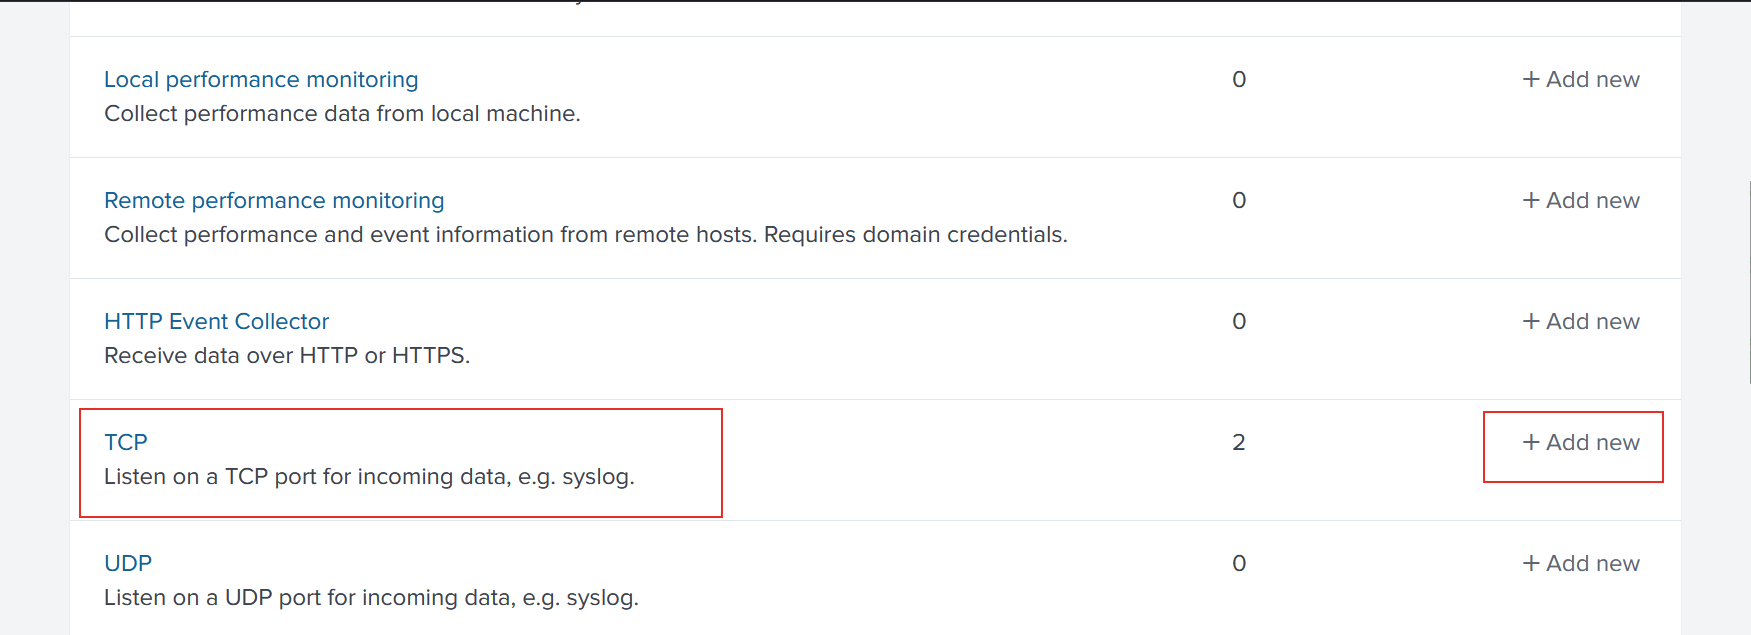
Select TCP to set up the TCP Server
Click Add new
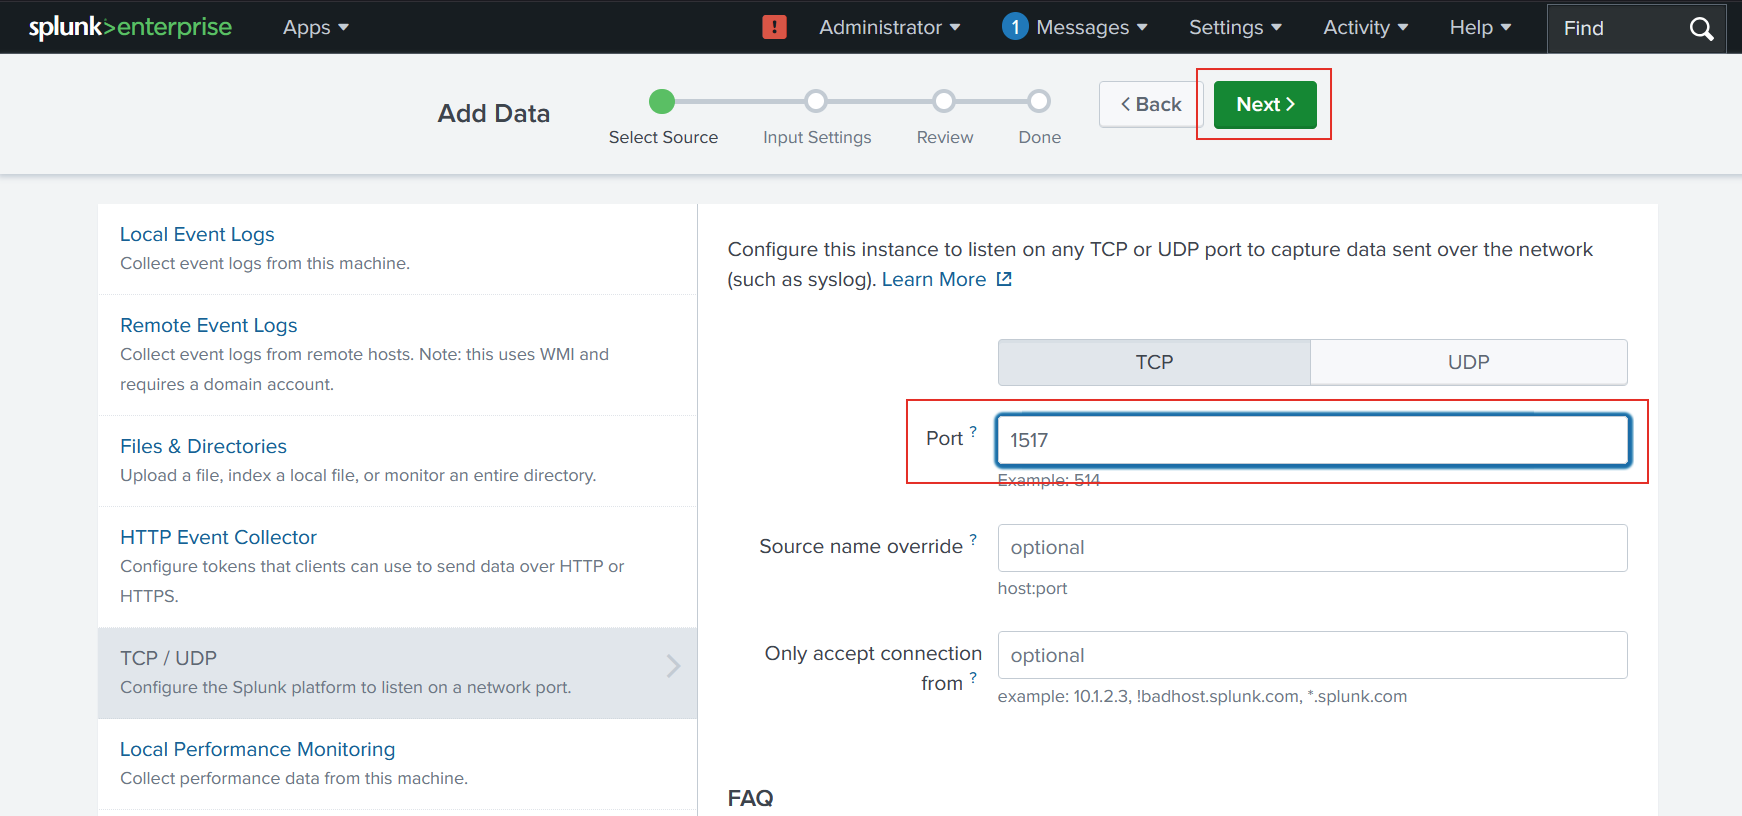
Choose TCP port of server (E.g. Port 1517)
Click Next
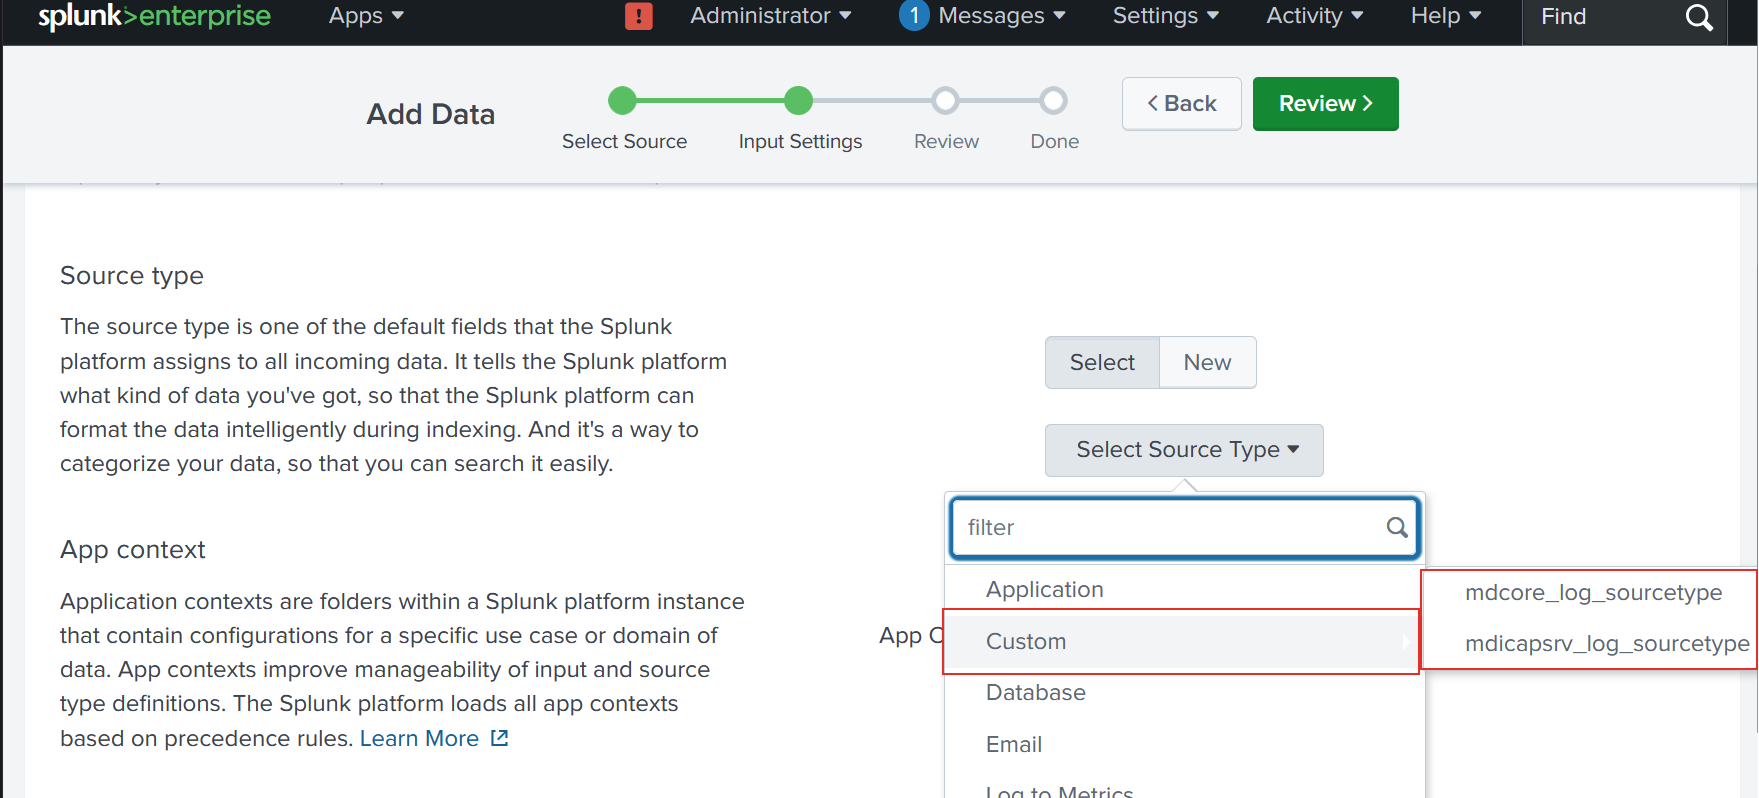
Set up Input Settings → Custom:
mdicapsrv_log_sourcetype: for MetaDefender ICAP Server, ormdcore_log_sourcetype: for MeteDefender Core
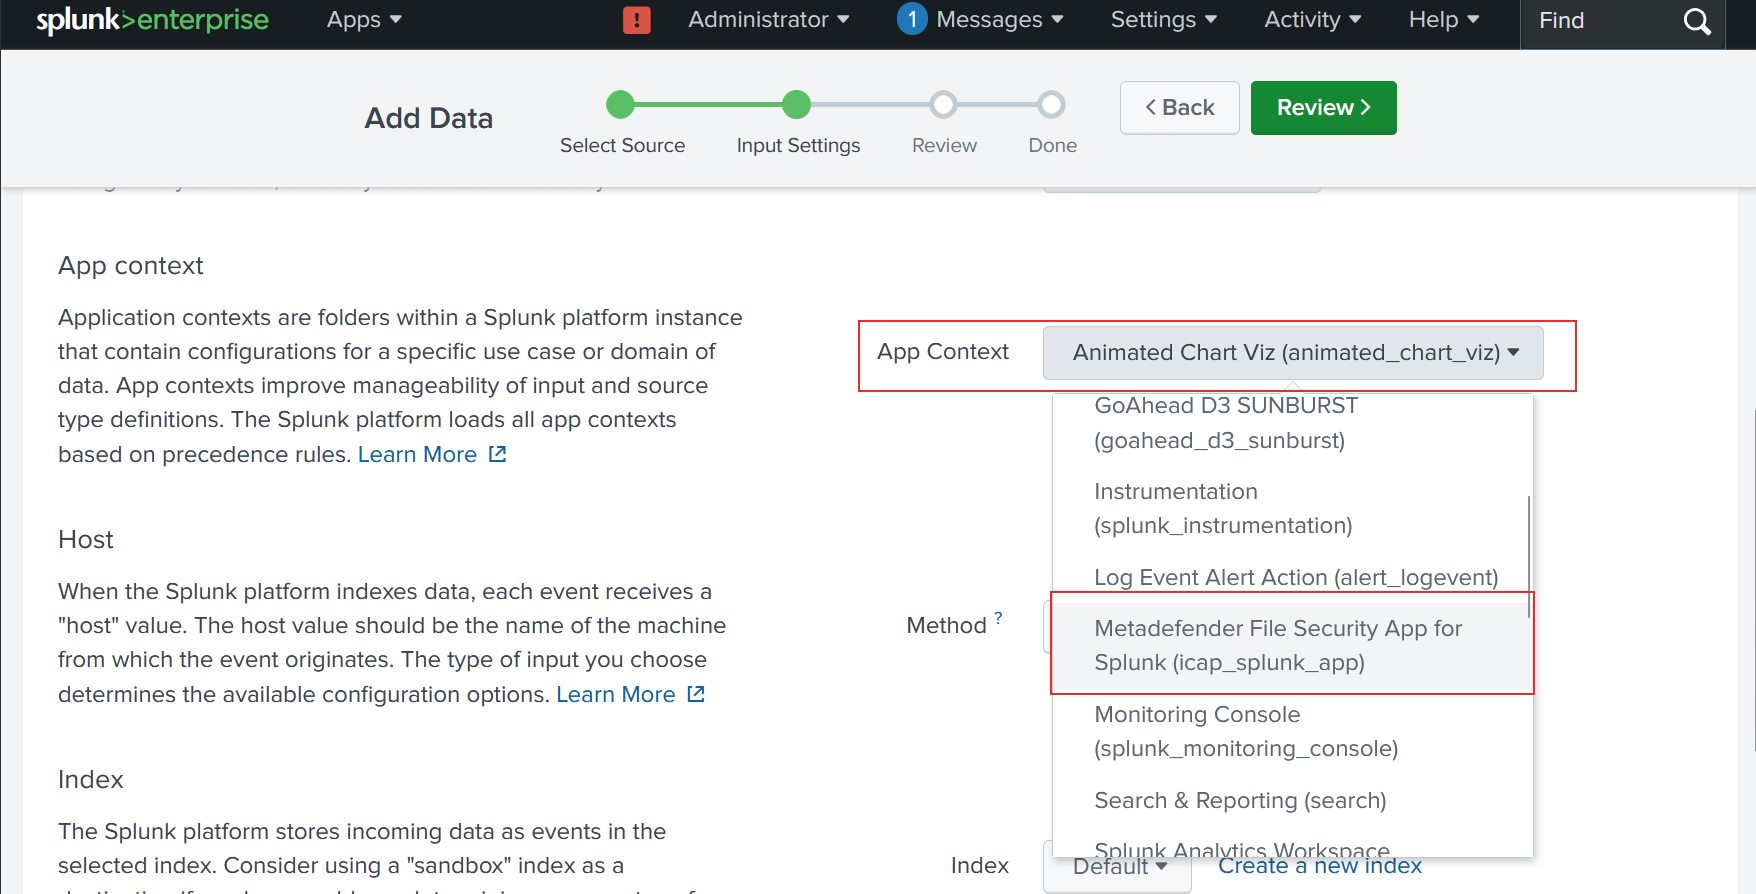
Under App context, select MetaDefender File Security App for Splunk
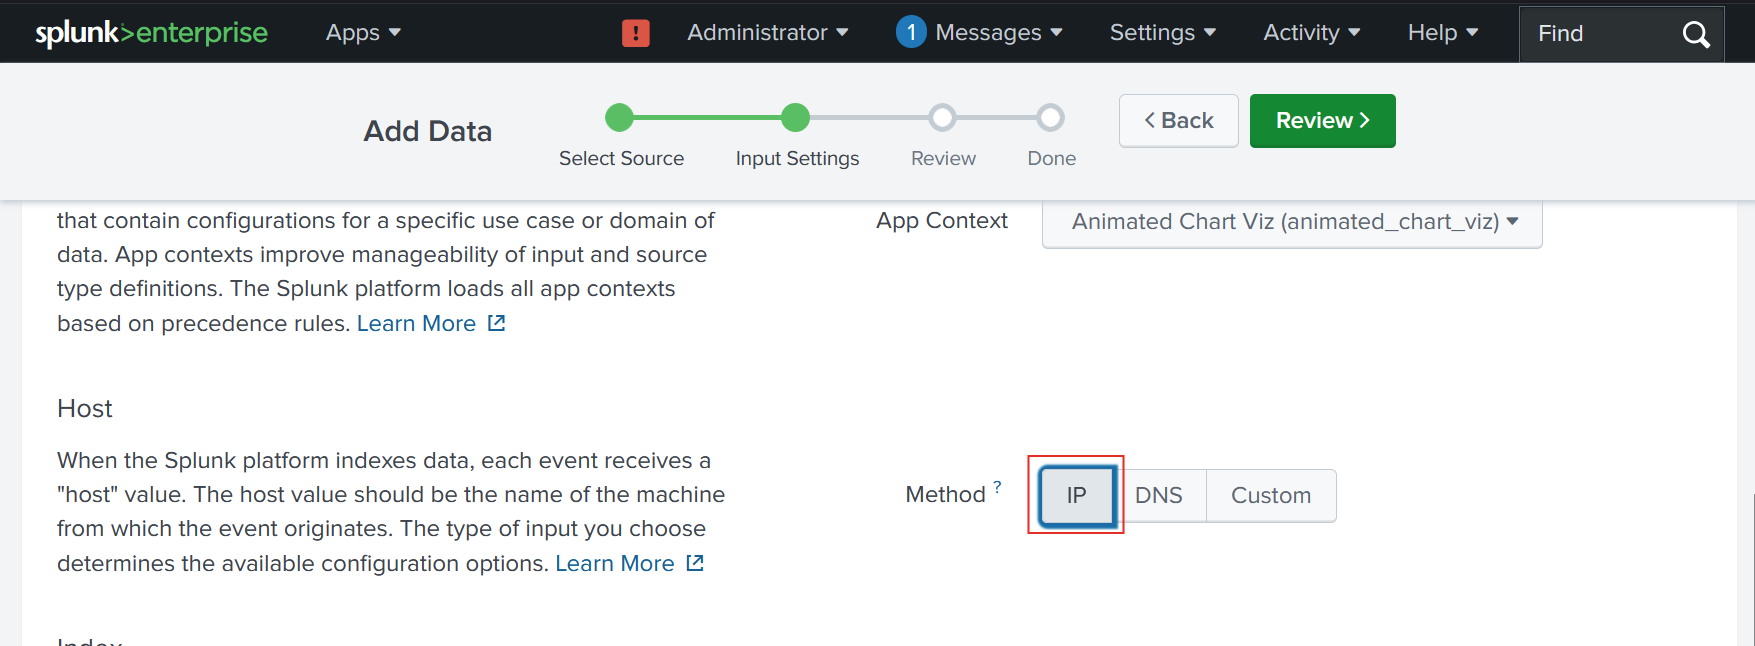
Under Host, select IP.
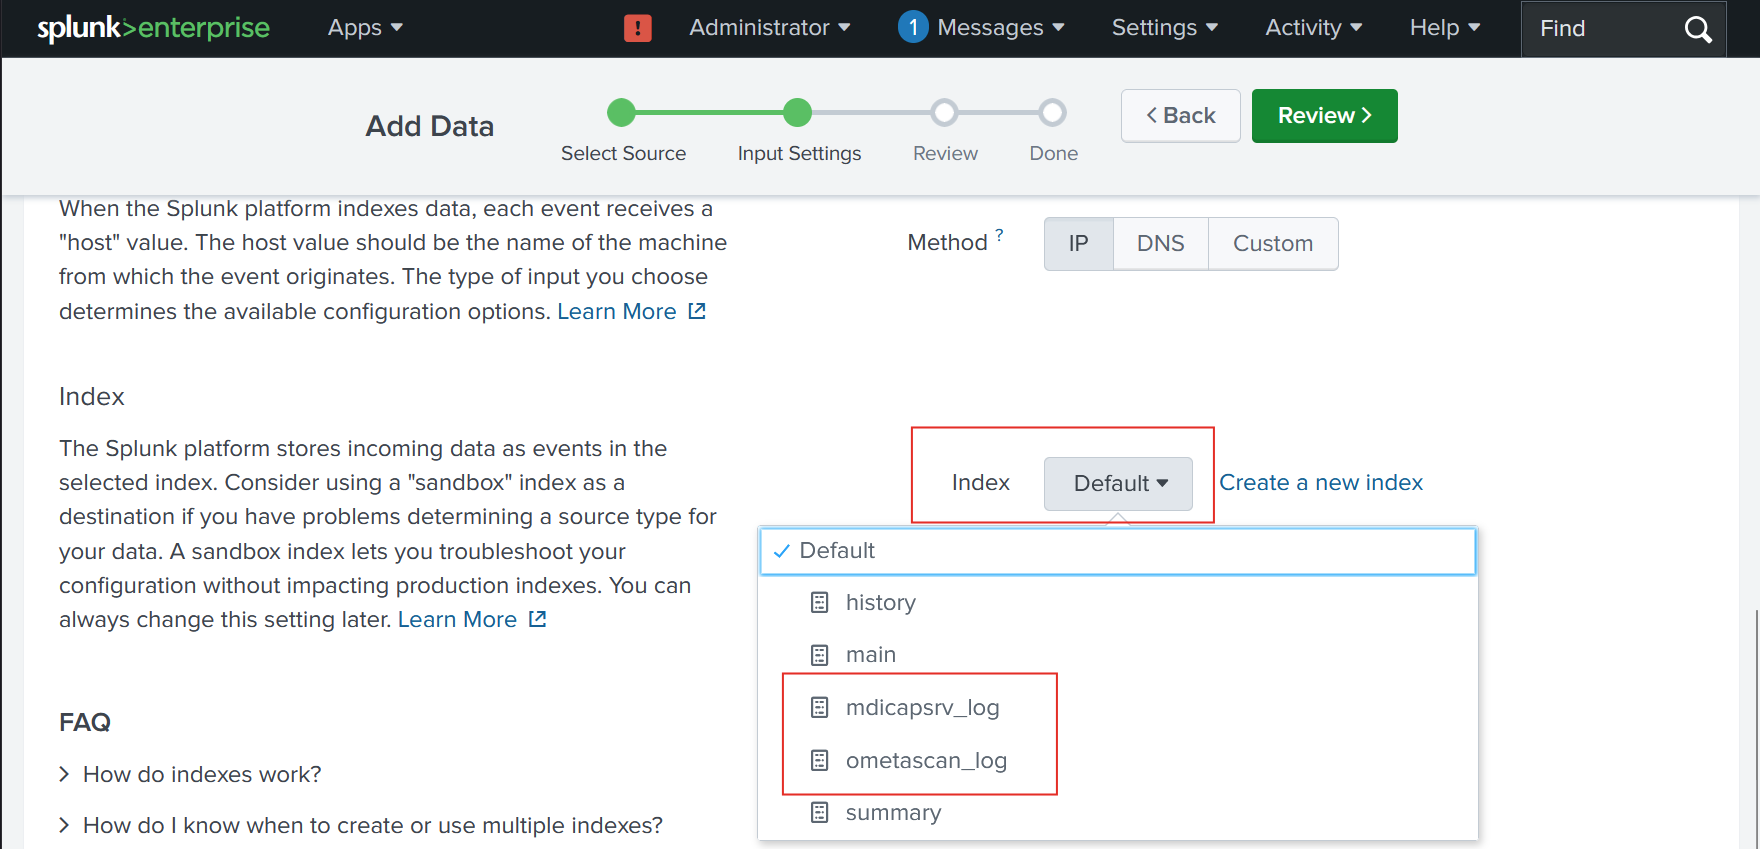
Index: Select
mdicapsrv_logfor MeteDefender ICAP Server orometascan_logfor MetaDefender Core
Click Review and Submit.
Configure MetaDefender ICAP Server and MetaDefender Core
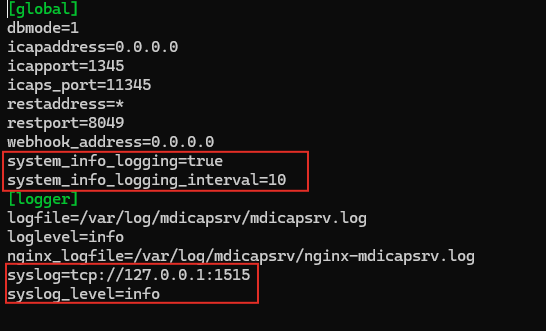
To collect the system statistic such as CPU, RAM, and disk space from MetaDefender ICAP Server, enable the following option in the configuration file:
systeminfo_logging=true (This setting is mandatory for logging the resource information)
By default, resource logging occurs every 15 seconds. To adjust the frequency, use this flag option: systeminfo_logging_interval.
(refer to Configuration file for more information)
Forward Logs to Splunk via TCP
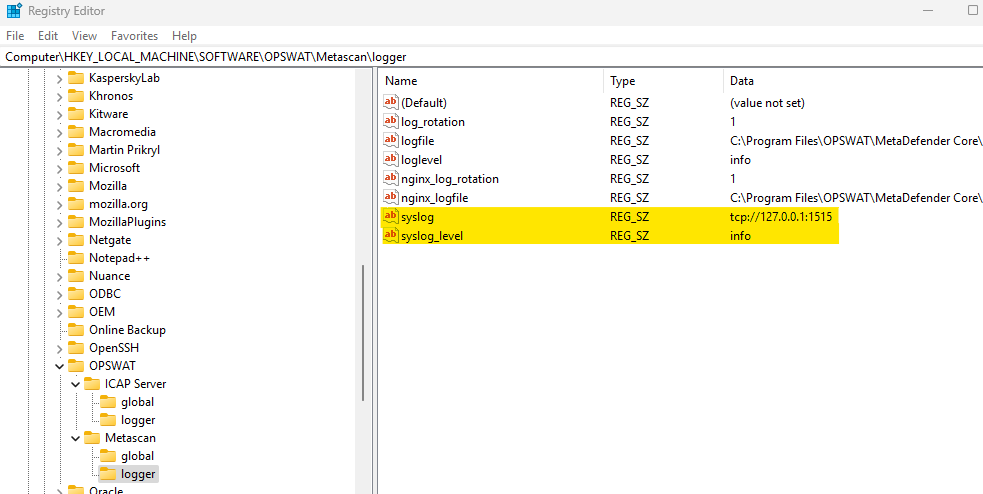
The syslog feature of MetaDefender ICAP Server and MetaDefender Core will help send the log to the Splunk server via TCP directly.
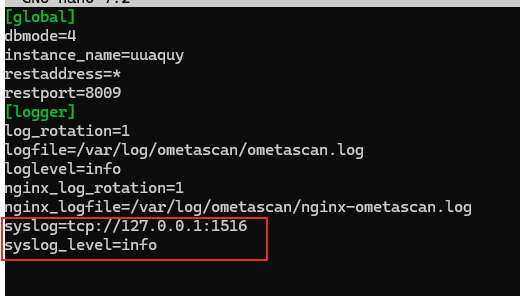
For example, if the Splunk Server IP address is 127.0.0.1 and opens receive the log at port 1515, then configure the logger section with:
syslog=tcp:/127.0.01:1515
syslog_level=info
This version does not support log under CEF format.
You need to disable CEF format (disabled by default) to work normally
To disable CEF, set cef=false in logger section
Refer to these links for more information:
MetaDefender ICAP Server:
Linux: logger session
Windows: Logger
MetaDefender ICAP Server
Windows
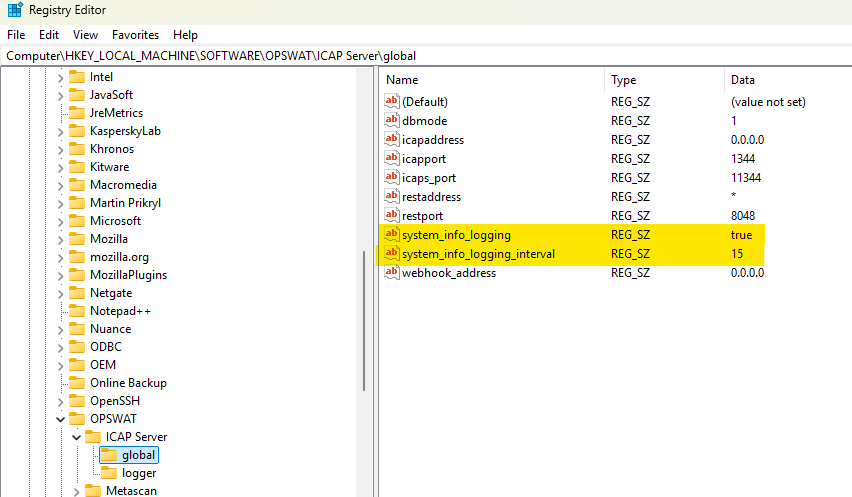
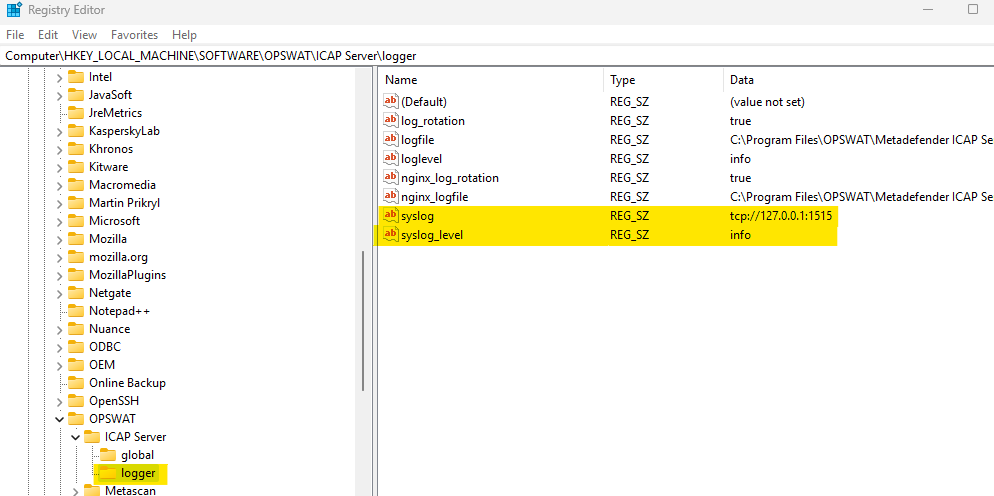
Linux (
file: /etc/mdicapsrv/mdicapsrv.conf)
MetaDefender Core
Windows:
Linux (
file /etc/ometascan/ometascan.conf)
Splunk Chart UI Components
System Resource Monitoring
Monitor CPU, memory, and disk space used over time.
Monitoring CPU, memory & disk space used
Throughput Requests & Processed Requests
Details on how many requests processed in 1 hour/day (user can select this)
See the number of processed requests and the number of blocked requests
Show the percentage of the allowed vs. blocked request and the scan verdicts
Scan Server Insights
Track the total number of scanned files
Monitor the finished and failed scans of each scan server
Failed scans: All files that are not scanned due to errors (Overload, Could not connect, Scan timeout, etc.)
Successful scans: All files that are scanned with a returned JSON result, including verdict to client
Percentage of scan file for each scan server workflow
Number of Processed Requests per Client Address & ICAP Client Address
Display the number of requests (that are blocked or allowed) for each of the client IP address
Filter by client address or show the top X values of client address
Detailed Scan Server Address View
In the Statistics Files per Scan Server view:
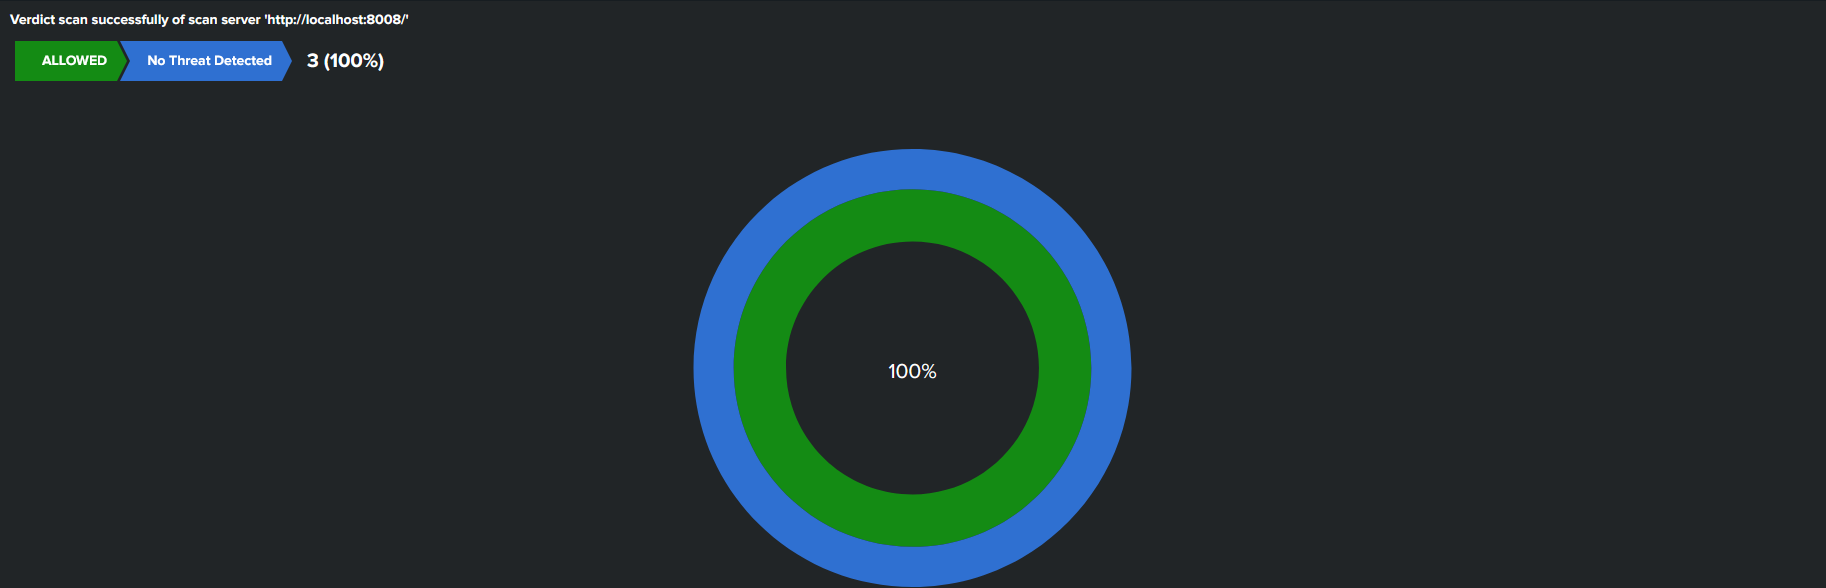
Click on the chart column (scan finish or failed) → Show Detail of Scan Successful (by Scan Server Address) or Scan Failed (by Scan Server Address)
Apply filter by action (allowed or blocked), verdicts, and workflows
Sort scan result by verdicts or number of files
MetaDefender Core Monitoring
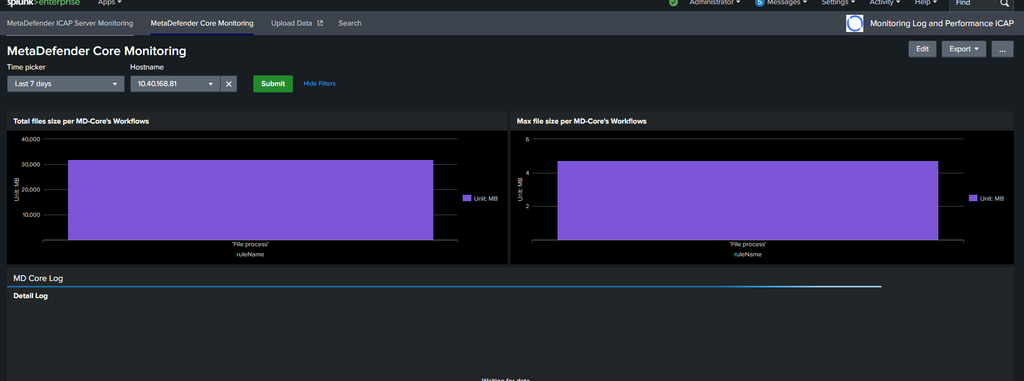
Total files size per MetaDefender Core’s Workflows: Displays the total processed file size, grouped by
ruleName, in megabytes (MB).Max file size per MetaDefender Core’s Workflows: Shows the maximum file size processed in each workflow, grouped by
ruleName, in MB.