The performance fine tuning guide describes how to configure the MetaDefender Core application and build the appropriate computing server to gain optimal file processing performance.
This document is intended for system administrators.
Performance metrics
While processing files on MetaDefender Core, service performance is measured by various metrics. Some of them are commonly used to define performance levels, including:
Performance metrics | Description |
|---|---|
Throughput (number of processed objects per hour vs. number of processed files per hour) | On MetaDefender Core, meaning of “files” and “objects” are not the same.
The primary metric used to measure average vs peak throughput of a MetaDefender Core system is “processed objects per hour.” |
Submission load (number of successful requests per second) | This performance metric measures the load generated by a test client application that simulates loads submitted to MetaDefender Core. A submission is considered successful when the client app submits a file to MetaDefender Core and receives a dataID, which indicates that the file has successfully been added to the Queue. Submission load should measure both average and peak loads. |
Average processing time per object | The primary metric used to measure processing time of a MetaDefender Core system is “avg processing time (seconds/object).” |
Total processing time (against certain data set) | Total processing time is a typical performance metric to measure the time it takes to complete the processing of a whole dataset. |
Factors impacting MetaDefender Core performance
MetaDefender Core file processing performance can be influenced by a variety of factors related to software, hardware, and the operating system. Here are the key factors and the guidelines:
Hardware factors and guidelines
It is recommended to use a standard benchmarking tool such as Geekbench or PassMark to check for any hardware-related performance issues.
These are a few key hardware components that could impact MetaDefender Core and system performance:
CPU
OPSWAT performance testing is based on cloud (AWS instances) and on-premises (Dell servers) systems and recommends CPUs with a Geekbench score of >1050 for single core performance and >3700 for multi-core performance (Geekbench).
The number of vCPU cores needed depends on the AV engine package and other OPSWAT engines in use (e.g. Deep CDR, Proactive DLP). Customers should review our package efficacy report to determine the appropriate engine package.
The minimum requirement is 8 vCPUs for Metascan only, and 12 vCPUs if both Metascan and Deep CDR technologies are needed. Please refer to our documentation on recommended system configurations for more information.
RAM
Sufficient memory is essential for handling large files, multiple concurrent scans, or a large number of engines. Insufficient RAM can lead to swapping and slowdowns. DDR4 or DDR5 RAM is recommended for optimal speeds. The minimum memory requirement is at least 16GB of RAM to support Metascan and Deep CDR. Please refer to our documentation on recommended system configurations for more information.
Storage
Storage speeds affect how quickly files are read and written during the scanning process. This factor is even more important when processing archive files on MetaDefender Core since it involves a lot of archive extraction tasks to create and write nested files.
High-speed storage (M2, SSD with >100K IOPS) is recommended. For virtualized environments, RAID 1 is recommended as it has a faster IO write speed than RAID 5.
The minimum storage requirement is at least 70GB of free space. Please see recommended storage requirements for more information.
Network
When connected to a client such as MetaDefender Kiosk for network scanning, the speed and latency of the network connection can impact performance, especially if large files are being transferred. A minimum of 1 Gbps (125 MB/sec) is required and 5Gbps is highly recommended to avoid potential network-related issues while downloading files.
Other hardware settings
For on-premises systems, BIOS firmware settings related to power management, processor, memory and disk settings could also vastly impact overall system performance. BIOS settings should be configured for maximum performance (avoiding any power optimized settings).
Operating system guidelines
OS Version
The version and architecture (32-bit or 64-bit) of the operating system can impact performance, with newer versions and 64-bit architectures typically offering better performance and support for more memory.
These are the recommended operating systems:
Windows: Windows Server 2022, 64-bit
Linux: Linux Red Hat Enterprise 9, Debian 11 or Ubuntu 22.04
Background Processes
The number of background processes and services running on the operating system can consume resources and impact scanning performance. Any nonessential background processes should be suspended.
File System Type
Different file systems (e.g. NTFS, FAT32, ext4) have varying performance characteristics that can affect how quickly files are accessed and scanned. We recommend NTFS on Windows and ext4 on Linux.
Windows Power profile are a collection of hardware and system settings, including processor power management, that regulate performance and power consumption. “Balanced” or “Power Saver” profiles can throttle CPU processing and can significantly reduce performance. Your system power profile should be set to “Performance” settings (e.g. “Best Performance”, “High Performance, “Ultimate Performance”).
Software factors
MetaDefender Core version: It is always recommended to use the latest MetaDefender Core version for the best performance and to avoid running into legacy stability issues while operating.
Engines: The number of engines configured to process files can greatly impact performance. More engines provide better security but could slow down the scanning process.
MetaDefender Core configuration: Scan settings, such as deep scans, heuristic analysis, and archive scanning, can affect performance. More thorough scans require more resources and time.
File characteristics (file type, file size): The types of files being scanned (e.g., executables, archives, multimedia files) can impact performance since some file types are more complex than others.
Concurrent Scans: The number of simultaneous scans being performed can impact overall performance, as resources are divided among the concurrent tasks.
Integration Method: How MetaDefender Core is integrated into other applications (e.g. via APIs) can also influence performance, especially if the integration is not optimized.
Performance Tuning
Understanding requirements
MetaDefender Core and its engines utilize system resources as much as possible to boost throughput while not exceeding a pre-defined threshold (e.g. 90-100%) continuously for extended periods to maintain system stability.
Prior to making any performance tuning, the following considerations need to be made:
Expected outcome (i.e. a baseline for performance)
Throughput rate (processed objects/hour)
Avg. processing time (seconds/object)
Use case (Multiscanning, Deep CDR, Adaptive Sandbox, etc) and package (MetaDefender Core 8, MetaDefender Core 16, etc)
Environment (virtually/physically hosted on-premises or in the cloud) and deployment (native installation, docker, Kubernetes, AMI)
Number of vCPUs and CPU speed
Memory
Free storage space
Additional factors such as power profile, BIOS settings
System, Application, Database Tuning
Performance tuning can be broken down into three components:
System and Environment Tuning
MetaDefender Core Application Tuning
MetaDefender Core Database Tuning
To identify potential bottlenecks in specific circumstances, it is important to understand the problem (i.e. system resource issue, application bottleneck) to determine the best course of action.
System and Environment Tuning
Please see system environment recommendations below:
Environment | Use Case | CPU Cores | Memory | Free Disk Space* | Additional Environment tuning |
|---|---|---|---|---|---|
Windows - Multi-scanning | MetaDefender Core 8 | 8 | 8 GB | >166 GB | Network speed: >1Gbps BIOS settings: max performance Operating System: Windows Server 2022, 64-bit File system: NTFS Windows Power Profile: Best/High/Ultimate performance |
MetaDefender Core 12 | 16 | 16 GB | >174 GB | ||
MetaDefender Core 16 | 16 | 16 GB | >182 GB | ||
MetaDefender Core 20 | 32 | 16 GB | >190GB | ||
MetaDefender Core MAX | 32 | 32 GB | >270GB | ||
Linux-multi-scanning | MetaDefender Core 5 | 4 | 4 GB | >160 GB | Network speed: >1Gbps BIOS settings: Max Performance Operating Systems: Linux Red Hat Enterprise 9, Debian 11 or Ubuntu 20.04 File system: ext4 |
MetaDefender Core 10 | 8 | 8 GB | >170 GB | ||
MetaDefender Core MAX | 16 | 16 GB | >190 GB | ||
CDR and DLP | Deep CDR and Proactive DLP | +4 | +8 GB | There are additional vCPU and memory requirements for different configurations. For example, MetaDefender Core 8 + CDR + DLP requires 12 vCPUs and 16GB RAM. | |
Embedded Sandbox engine | <5000 scans/day | +4 | +4 GB | ||
10000 scans/day | +8 | +8 GB | |||
25000 scans/day | +16 | +16 GB |
vCPUs*: CPU speed with a Geekbench score >1050 for single core performance and >3700 for multi-core performance.
Free Disk Space*: Free storage space requirements depend on the types of files, use cases, and throughput. See storage requirements documentation for more information.
MetaDefender Core Application Tuning
MetaDefender Core Tuning Process
Like any other high-performance applications, MetaDefender Core performance tuning involves a systematic approach to identifying and resolving performance bottlenecks. Here is a typical procedure for tuning the performance of an application:
Define performance goals:
Identify key performance indicators (KPIs) with metrics such as throughput, total processing time, and resource utilization thresholds.
Set performance targets: establish acceptable performance thresholds for KPIs.
Define constraints: Understand targeted environments, use cases, and application and system constraints. Understand what can and can’t be changed. Understand what can be changed and what can’t be.
Establish a baseline: measure, capture, and document performance levels using monitoring tools.
Identify bottlenecks and propose remediation plan:
Analyze logs to identify culprit(s) causing performance bottlenecks, while monitoring resource utilization (CPU, memory, disk, network) to identify resource constraints.
Determine the impact of each identified issue on overall performance, and then focus on issues with the highest impact on performance. This issue remediation may also require tuning MetaDefender Core application settings.
Design test case and perform load testing: Ensure all KPIs are measured, captured, and logged for analysis.
Review and repeat: Analyze captured performance test results, identify issues, continuously iterate and calibrate application settings, and re-run performance load tests until the performance target is achieved.
MetaDefender Core Tuning Guide
Setting Name and how to set | Description | Default value | Recommended settings and when to change |
|---|---|---|---|
MetaDefender Core temporary folder Windows: Registry Linux: File | Location where all temporary files (e.g. during extraction) are written into and read from, crucial for IO read and write. | Inside installation folder | When large number of temp files are written (e.g. processing large archive files) Temp folder should be kept in high speed storage such as M2, SSD or RAM disk. |
MetaDefender Core queue size Use MetaDefender Core v5 via REST API to update: https://docs.opswat.com/mdcore/knowledge-base/how-can-i-configure-the-maximum-queue-size-in-metadefender-core- | All submitted scan requests, when accepted, are designated as a task slot sitting in MetaDefender Core queue. For archive file submissions, MetaDefender Core needs to extract archive files to nested files for individual and separate scanning. Each nested file scanning task will be tracked as a separate slot in MetaDefender Core queue. | 500 | In high throughput use cases and when system has >32 vCPU cores and CPU utilization is low. Increase queue size incrementally until desired throughput/speed/utilization is achieved. When processing large archive files and when system has >32 vCPU cores with many small, nested files. Increase queue size to 5000-10000 depending on size of archive files. |
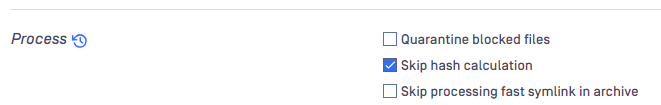
Skip hash calculation Workflow -> General -> Process -> “Skip hash calculation” | MetaDefender Core will calculate hash checksum against every submitted file for file integrity validated by users when needed after scanning. Hash calculation might require significant CPU resources and add significant overhead to overall processing time, especially for large files. | Skip hash calculation = <<disabled>> | When content of files doesn’t change often in high throughput environments Skip hash calculation = <<enabled>> |
Max file sizes setting Workflow -> General -> Max sizes -> File scan | Larger files lead to longer processing time for temporary file creation and access, as well as file hash calculation. Large files are usually in archive compressed file format, which require MetaDefender Core and its engines to extract and process nested files within. | 200 MB | In environments with limited resources, with large file processing causing performance bottlenecks Set max file to limit processing large files (e.g. 1000MB) |
Reuse processing result (i.e. cache processing results) Workflow -> General -> Process -> Reuse processing result | MetaDefender Core is supposed to process any files regardless of how many times the same files are re-submitted. There’s an available setting under MetaDefender Core workflow to allow MetaDefender Core to reuse processing results on the same file hash when meeting certain conditions (configurations and engines are not changed from the last result) | disabled | In use cases including email security, supply chain and cross domain most likely to reuse the same files (or even nested in different archive files) submitted repeatedly to MetaDefender Core for scanning Set value to enabled. |
Engine specific handling limits Workflow -> Archive -> Max recursion level, max number files, max total size Workflow -> Deep CDR -> Advanced -> specificFiletype -> Recursive Level | For example, archive handling limits (max recursive level, max total extracted files, max total size of extracted files) will tremendously impact overall file processing. A higher limit means MetaDefender Core needs to dig deeper to process them. | depends on module | When resource utilization is very high (i.e. 100% CPU utilization) and files contain many archived files. Incrementally reduce level and observe resource utilization. |
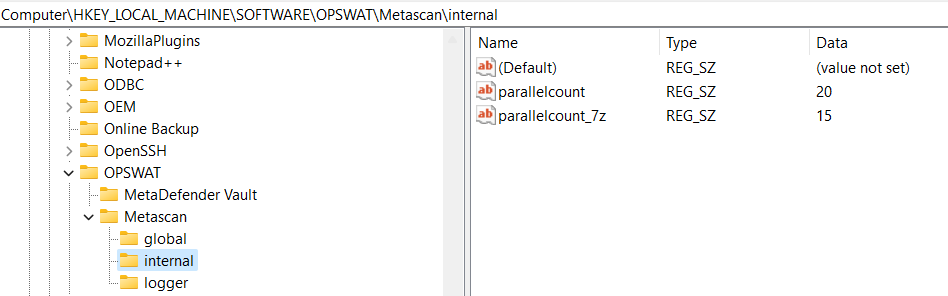
Engine parallel count Windows: Registry
Linux: File | MetaDefender Core needs to open a certain number of threads on the system to communicate and send tasks to each engine underneath. The max number of threads to be allowed is defined as the parallel count setting on each engine, and this limit can be configured differently for each engine. This limit can be increased to push more tasks to engines when applicable. However, increasing this limit does not always mean higher throughput produced by engines. Too many threads opened might overload engines. We recommend lowering the parallel count for the sandbox engine when MetaDefender Core uses remote sandbox. | parallelcount=20 parallelcount_7z=-1 | When observed throughput is low, the system has >32 vCPU cores, and resource utilization is low. Incrementally increase parallel count and observe throughput. When scanning large archive files, increase Archive extraction engine parallel count to 15. When MetaDefender Core uses remote sandbox, lower parallel count to 5. Note: parallel_count should not exceed 50 |
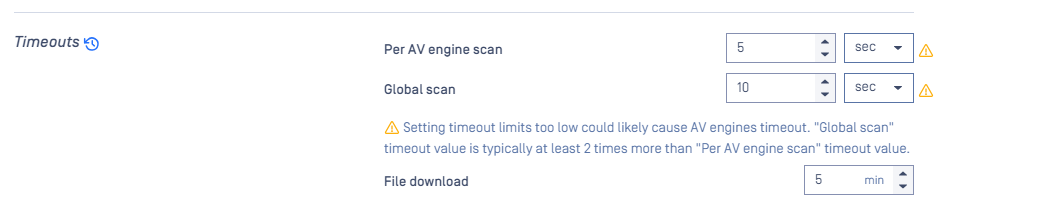
Engine scan timeout Workflow -> Metascan -> Timeouts | MetaDefender Core controls engine processing timeouts according to set configurations. By default, 1 minute is allocated for each Metascan AV engine, and 10 minutes for the entire Metacan AV scanning stage. Under normal conditions, Metascan AV engines only take milliseconds to around 30 seconds to scan a file. Lowering this timeout threshold to seconds will help MetaDefender Core move on quickly without waiting on any unexpectedly slow scanning from any engine. At the same time, to ensure Metascan AV scanning outcome quality, consider setting Metascan AV failure threshold to reject scans where a set number of Metascan AV engines times out (fails). | Metascan
| In high throughput use cases, set AV engine scan timeout:
|
Processed (sanitized) file storage Windows: Registry Linux: File | Similar to temporary file storage, when enabled with our advanced threat prevention, Deep CDR, MetaDefender Core will write and store sanitized output files in a designated location, which is set to the inside of the MetaDefender Core folder by default. | Inside installation folder | Recommended to use high speed local disk for sanitized files storage for optimal processing. Temp folder should be set to a high-speed disk such as M2, SSD or RAM disk. |
Max number of database connections Windows: Registry Linux: File | MetaDefender Core opens connections to communicate and work with PostgreSQL database server. By default, 10 connections are opened, adjustable via configuration. | 10 | In a high throughput environment when database utilization is low. Increasing this limit could help in case of performance bottlenecks due to slow database processing. |
Logging channels Windows: Registry loglevel wineventlog_level syslog_level Linux: File loglevel syslog_level | MetaDefender Core supports various channels for operational logging including product own log files, syslog, Windows event log. | loglevel=info | Unless required, disabling unsupervised logging channels (e.g. Windows event log) should help increase overall performance. |
MetaDefender Core Database Tuning
MetaDefender Core uses PostgreSQL relational database to store application settings and processing results. Most product transactions on MetaDefender Core require a database query and update (e.g. existing scan result lookup, new scan result insert). It’s crucial to keep the product database well-maintained and robust for the most optimal scanning throughput, and to achieve the best user experience for overall product performance.
The following measures should be implemented for database tuning:
Database deployment model
Hardware considerations
PostgreSQL configurations
MetaDefender Core configurations
Routine database maintenance
Monitoring and calibration
Database deployment model
There are two main modes on MetaDefender Core deciding how PostgreSQL database is leveraged:
Persistent mode (Stateful): MetaDefender Core will store any scan results into PostgreSQL database for further lookup.
Non-persistent mode (Stateless): MetaDefender Core will not store any scan results into PostgreSQL database. For every scan request transaction, it returns scan results back to the client side via webhook callback and finalizes transactions without storing anything in database. There is no need to consider performing database tuning in this mode.
In the persistent mode, depending on business requirements, users are supported with two different database deployment models:
Standalone database: Each MetaDefender Core instance has its own PostgreSQL database to operate with, and when deploying multiple MetaDefender Core instances using the standalone database model, those PostgreSQL database servers are isolated and not connected to each other.
Shared database: MetaDefender Core instances will share the same PostgreSQL database server for configurations and historic scan results. This ensures that all MetaDefender Core instances will always use the same configurations and have full access to other MetaDefender Core instances' scan histories. This provides a consolidated data warehouse for client query and a consolidated view for IT administration.
Consider these pros and cons when choosing shared database for usability over performance:
Pros | Cons | When to consider | |
|---|---|---|---|
Standalone database |
|
|
|
Shared database |
|
|
|
Hardware consideration
Memory: Ensure your server has sufficient RAM. More RAM allows for larger caches, reducing storage I/O.
CPU: Multi-core CPUs improve parallel query performance. Choose CPUs with higher clock speeds for better performance.
Storage: Use SSDs for faster read/write operations. RAID configurations (e.g., RAID 1+0) can provide a good balance between performance and redundancy.
PostgreSQL configurations
The most crucial prerequisite for optimal PostgreSQL performance is having plenty of RAM capacity and high-speed storage I/O.
Modify the PostgreSQL configuration file (postgresql.conf) to optimize performance based on your hardware and workload. Users can find this conf file at <PostgreSQL install location><version>\data\postgresql.conf
Memory Settings
shared_buffers: This is the amount of memory dedicated to caching data. Set to 25-40% of available RAM.
work_mem: Allocate enough memory for sorting and hashing operations. A starting point can be 4-16 MB, adjusted based on workload.
maintenance_work_mem: Use a larger value (e.g., 64-512 MB) for maintenance operations like vacuuming and index creation.
effective_cache_size: Set to 50-75% of total system memory. This helps PostgreSQL estimate the likelihood of cached data.
autovacuum_vacuum_threshold: Use a large value (e.g. 100000) for less redundant vacuum execution.
autovacuum_vacuum_scale_factor: Set to 0 to ensure that auto-vacuum can execute properly and reduce storage space usage.
Checkpoint Settings
checkpoint_timeout: Increase to 15-30 minutes to reduce the frequency of checkpoints.
wal_buffers: Increase to 16 MB or higher for better write-ahead logging performance.
WAL (Write-Ahead Logging) Settings
wal_level: Use minimal if not using replication; otherwise, replica or logical may be needed.
max_wal_size: Increase to reduce the frequency of WAL file recycling (we recommend greater than or equal to 2GB).
MetaDefender Core configurations
There are a few MetaDefender Core configurations that vastly impact to database performance:
Data retention setting
Reference: https://docs.opswat.com/mdcore/configuration/data-retention
Time frequency deciding when to mark old database-relevant records as “deleted” and not usable for data query anymore. The actual data wipe-up will be triggered later to reclaim disk space when PostgreSQL runs auto vacuuming, or when running database maintenance utility.
Lowering this threshold should keep database size manageable over time (combined with regular database maintenance practice) which eventually helps with overall performance, however the downside is usability and security compliance to keep data for a sufficient period of time.
Database connection pool
Reference: https://docs.opswat.com/mdcore/configuration/metadefender-configuration#internal-section (db_connection setting).
Maximum number of simultaneous connections to be opened by MetaDefender Core application to send SQL queries and work with PostgreSQL database server.
Increasing this threshold should utilize better PostgreSQL database server capacity when applicable, however this should be considered carefully with PostgreSQL bottlenecks in a shared database model.
Routine database maintenance
Run database maintenance utility on regular basis: https://docs.opswat.com/mdcore/operating/database-maintenance---metadefender-core-4-19-0-or-above
This utility covers the following important tasks:
Vacuuming: vacuum the database to reclaim storage and update statistics.
Analyze: run ANALYZE to update statistics for the query planner.
Reindexing: reindex tables to reduce bloat, especially if you notice degraded performance.
Monitoring and calibration
pg_stat_statements: Enable this extension to track query performance and identify slow queries.
pgTune: Use pgTune PGTune - calculate configuration for PostgreSQL based on the maximum performance for a given hardware configuration or similar tools to generate optimized configuration settings based on your server specifications.
Example via practice
Let’s look at an example that demonstrates the performance tuning process for MetaDefender Core to understand how we can achieve optimal results.
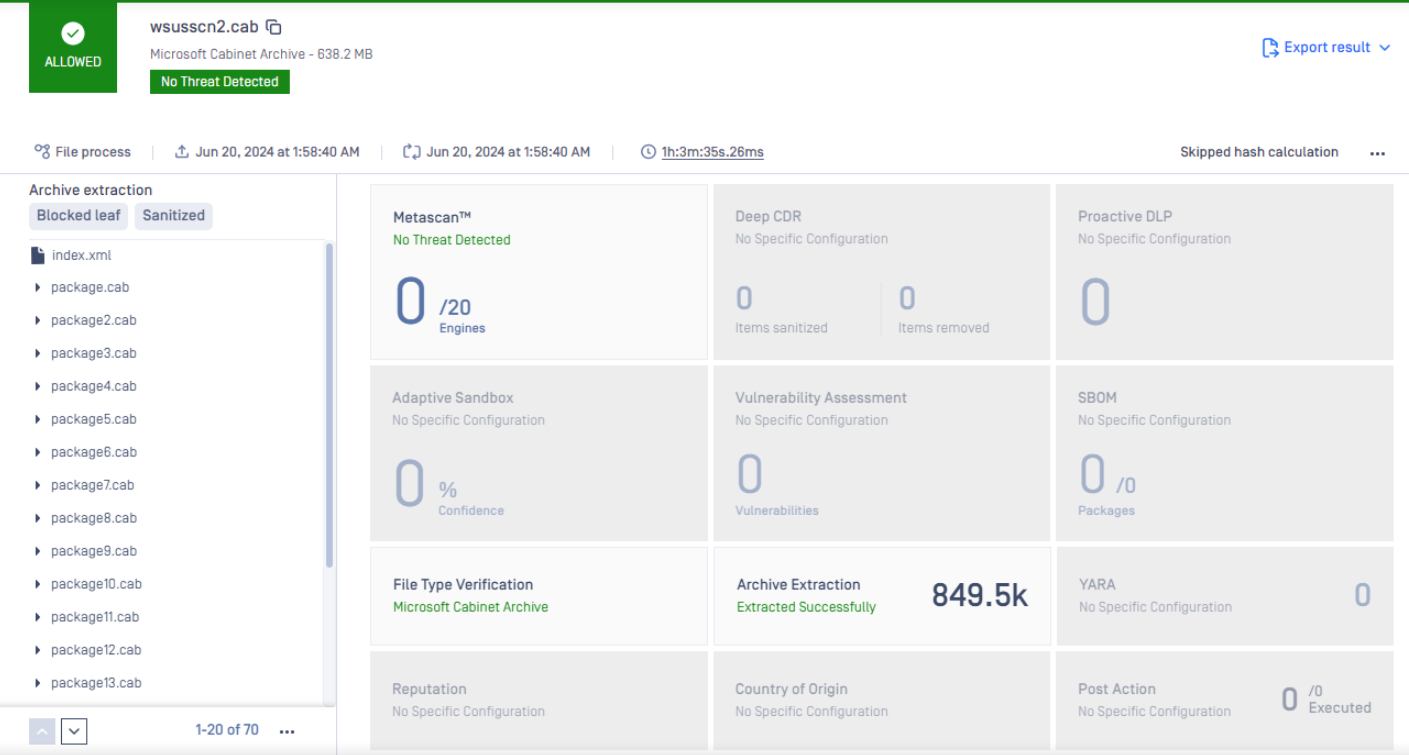
Problem statement: Scanning a large archive file wsusscn2.cab (size is 638MB with a total of 849.5K nested files inside) on MetaDefender Core 5.10.0 bundled with 20 AV engines with an expected total processing time of roughly 1 hour on a Dell PowerEdge R640 server running Windows Server 2022.
Based on this information, let’s define our goals and constraints:
Performance goals:
KPIs: the crucial metric to be measured here is the total processing time. CPU resource utilization should be also captured.
Performance target: total processing time is 1 hour or less, with an acceptable margin of error of 10% (i.e. 1 hour 6 minutes), and average CPU utilization should not be less than 50%, while the peak should be 100%.
Constraints:
Environment:
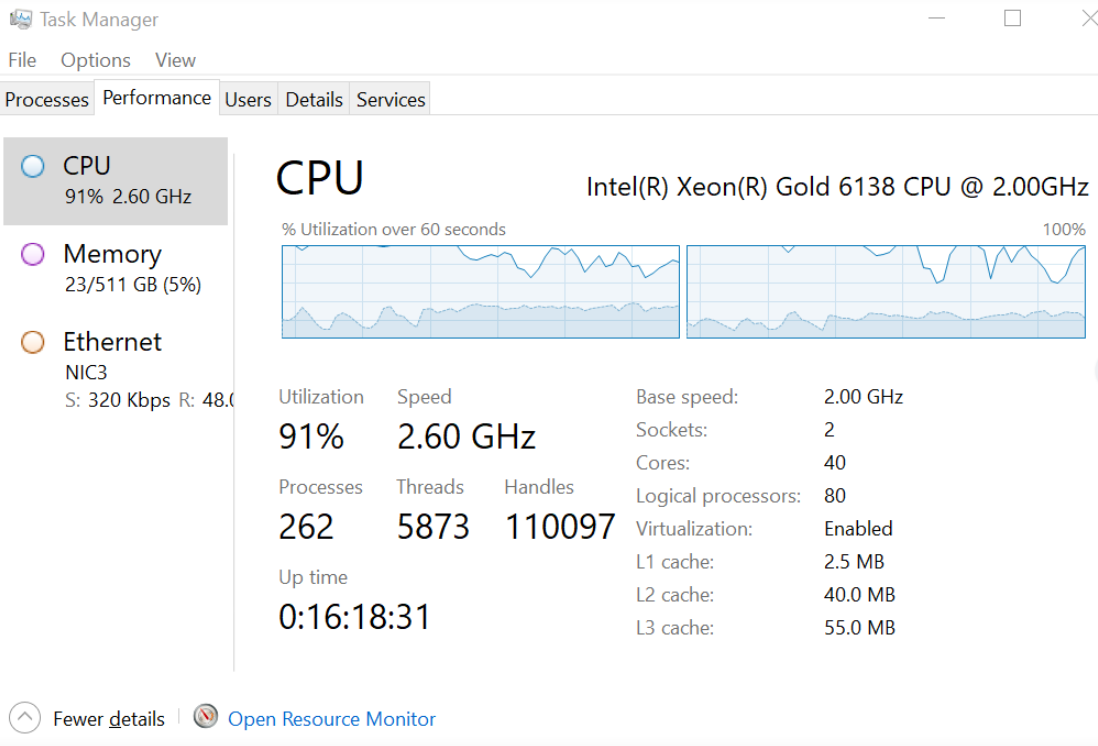
The performance test will be run and measured on the bare metal of the Dell PowerEdge R640 server (2 sockets, 40 CPU cores, 512GB RAM, 2x 480GB SSD RAID-1)
Windows Server 2022 is known as a reliable OS for high-performance applications such as MetaDefender Core.
Application:
MetaDefender Core version 5.10.0
20 AV engine standard package
Use-case: Submitting the sample file to MetaDefender Core directly via GUI, so no client application logic should be revised here.
What can be changed: MetaDefender Core settings, Windows OS power saving settings, Dell server BIOS settings.
What can’t be changed: Windows Server OS version, Dell PowerEdge R640 specs, sample .cab file, 20 AV engines, MetaDefender Core version.
Now that we’ve defined all goals and constraints, we can proceed with running and capturing baseline performance metrics to understand what we can achieve with MetaDefender Core default settings.
Establish baseline
The initial performance test run with MetaDefender Core default settings reveals that total processing time is 1 hour 32 minutes, with the average CPU utilization at just 47%.
Now that we understand our baseline, we can adjust our settings to reach the performance goal of 1 hour (+10%) while keeping average CPU utilization at 50% or above.
Identify bottlenecks
The next step is identifying bottlenecks. Equipped with our baseline data, there are a few key log items we want to analyze logs further in this step:
MetaDefender Core queue utilization is one of the crucial things to analyze, especially with archive file processing. By default, MetaDefender Core provisions 500 slots for the queue, capped at 25% of those slots for archive extraction. Obviously, these conditions are not optimal for this sample archive file test run. This sample file contains multiple levels of sub-archive files inside, thus when it is capped at 125 slots (25% out of 500), a lot of sub-archive files inside must wait in the queue due to the limited slot allocation for archive extraction at some points.
Hash calculation: MetaDefender Core is supposed to calculate hash checksums against every single file, including nested ones recursively inside the original archive. This leads to increased resource and time consumption. The sample file contains a total of 849.5K files inside, thus the total amount of time spent on hash calculation is measured in minutes.
Since this use-case is to submit the sample file to MetaDefender Core locally, the file integrity check can be omitted for smaller total processing time.
Parallelcount: Based on findings in logged data, the archive extraction task seems to take more time than necessary and tends to be timed out. Without any tuning, MetaDefender Core does not have any limit in opening threads to push tasks into its archive engine for extraction. When it comes to situations with numerous nested archive files needing to be extracted simultaneously, this could become an IO bottleneck and impact overall processing performance.
AV engine timeout: By default, MetaDefender Core waits for each AV engine to return with scan results before finalizing each AV scanning stage and moving to the next. Under high loads, there are numerous AV engine timeouts found in the application log. This also means waiting time in these circumstances are also related to engine timeouts, and consequently adding significant overhead on overall performance time.
Based on this analysis, we may implement the following remediation plan:
Queue size: increased to 10,000 to ensure enough slots in the queue are allocated for archive extraction.
Hash calculation: enabled “Skip hash calculation.”
Parallelcount: limited number of threads for extraction (parallelcount_7z) to 15, not unlimited.
AV scan timeout: reduced to less than 1 minute for “fail fast” approach, which allows MetaDefender Core to quickly recover and move on if any AV engines time out.
Design test case and perform load testing
The same test case should be used, now with fine-tuned settings value as mentioned in previous step.
Review and repeat
The new performance test result comes back as 1 hour and 3 minutes, which is meeting the performance goal.
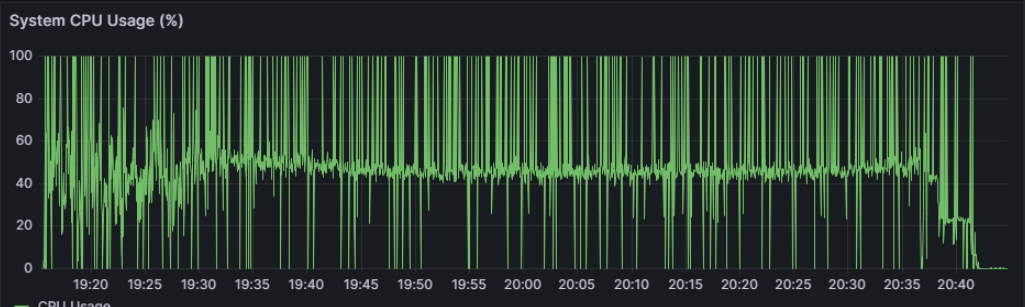
The CPU resource utilization is also monitored and we can see much higher utilization levels.
Performance monitoring
After MetaDefender is Core is tuned, it is crucial for the system to have a monitoring mechanism to ensure all metrics are monitored, in order to detect potential performance issues and remediate in a timely manner.
In MetaDefender Core context, some relevant parameters can be monitored for performance measurement:
Monitoring parameter | Recommendation |
|---|---|
System resources (CPU, RAM, Disk) | System resources utilization should be kept within acceptable range and issue alerts when exceeded for an extended time period. Some examples of system resource monitoring:
|
MetaDefender Core active performance | Can be collected via using a supported API https://docs.opswat.com/mdcore/metadefender-core#activeperformance MetaDefender Core performance metrics that should be monitored:
Alert setting should be configured after observing baseline and set proper threshold. |
MetaDefender Core health check | Can be collected via a using supported API https://docs.opswat.com/mdcore/metadefender-core#healthcheck Including MetaDefender Core’s
|