Enterprise Settings
This guide explains how to work with the enterprise console in Management mode: dashboard map (read-only context for sites), and the Settings pages scoped to the central enterprise (not an individual site or sensor). Adding sites or sensors is not performed from the enterprise console in current releases; use your deployment or site onboarding process instead.
1. Overview
1.1 Who should use this
Enterprise administrators and operators who manage the central MetaDefender OT Security deployment, monitor registered sites and sensors, and tune enterprise-wide policies and application options.
1.2 What you need
Network access to the enterprise console (
https://<enterprise-ip>).An account with rights to view or manage enterprise settings (per your organization’s RBAC).
Knowledge of how sites and sensors were onboarded in your environment (outside the enterprise console), if you need to correlate map or Component rows with physical locations.
1.3 Open Enterprise Settings
Sign in to the enterprise console.
If the UI is in Monitor mode (simplified view), click Go to Management to show the full management navigation.
In the header, open the region selector and choose the Enterprise entry (the central manager IPv4). Do not select a single site or sensor if you need enterprise-wide settings.
In the left sidebar, click Settings.
Confirm the URL is
https://<enterprise-ip>/settingsand that you see the full tab row (e.g. Component, Network & Discovery, Application, Backup, …).
Note: If you pick a site or sensor in the region selector, the Settings tabs are reduced (e.g. Alert, Replay PCAP, Application). That is site/sensor settings, not the full enterprise Settings surface.
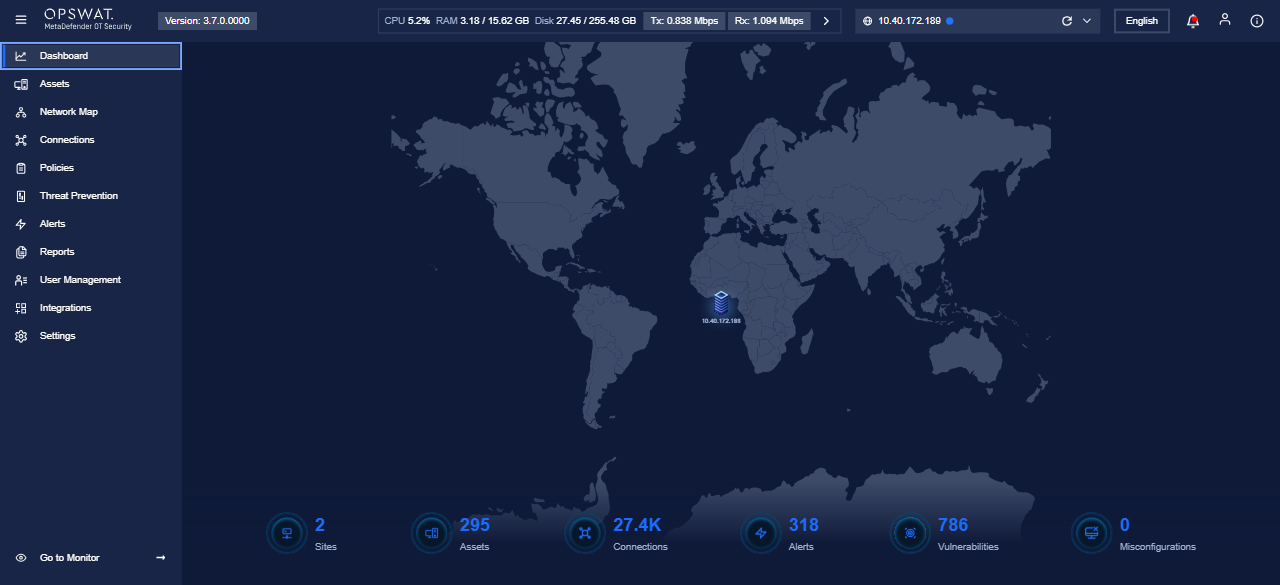
2. Dashboard & sites map
2.1 Purpose
The Dashboard gives a geographic/context view of registered Sites and high-level health: assets, connections, alerts, vulnerabilities, and misconfigurations.
2.2 What you see on the map
Markers or nodes for each site (often labeled with site IP or name, depending on configuration).
The map is interactive: use it to orient where sites sit relative to each other.
2.3 Summary tiles (footer)
Use the tiles for quick counts:
Sites — number of registered sites.
Assets — inventoried assets across the estate.
Connections — observed connection volume (indicator of traffic visibility).
Alerts / Vulnerabilities / Misconfigurations — open items requiring attention.
2.4 Typical workflows from here
Sites and sensors are not added from the enterprise Dashboard in current releases; the map reflects inventory that was registered through your deployment workflow.
Drill into Assets, Network Map, or Alerts from the sidebar for detail.
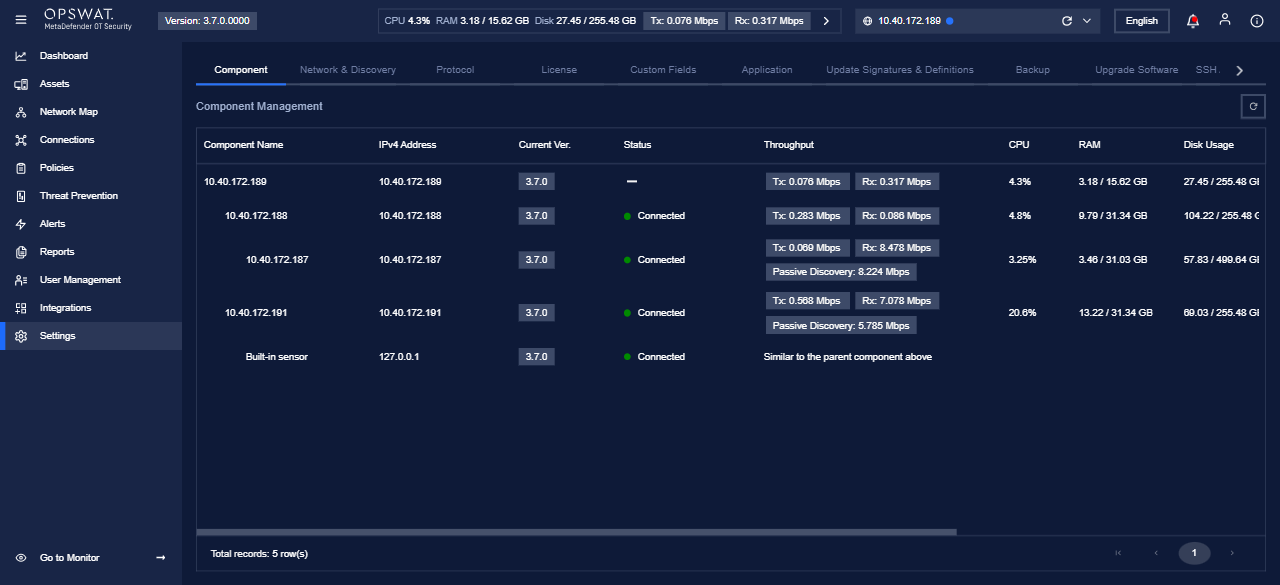
3. Settings — Component tab
3.1 Purpose
Component Management lists every major node the enterprise manages: the central enterprise host, remote sites, dedicated sensors, and the Built-in sensor where applicable. Use it to confirm version, connectivity, and resource usage.
3.2 Column reference
Column
Meaning
Component name / IPv4
Logical name and address of the node (enterprise, site, sensor, or built-in).
Current version
Installed MetaDefender OT Security software version.
Status
High-level connectivity/health (e.g. Connected).
Throughput
Tx/Rx traffic indicators; some rows show passive discovery throughput separately.
CPU / RAM / Disk
Resource pressure on that node; use for capacity planning.
Last updated
When metrics were last refreshed.
3.3 Actions
Use the row action menu (where available) for node-specific operations (version-dependent).
Use the header Updated: timestamp / refresh control to reload data after changes.
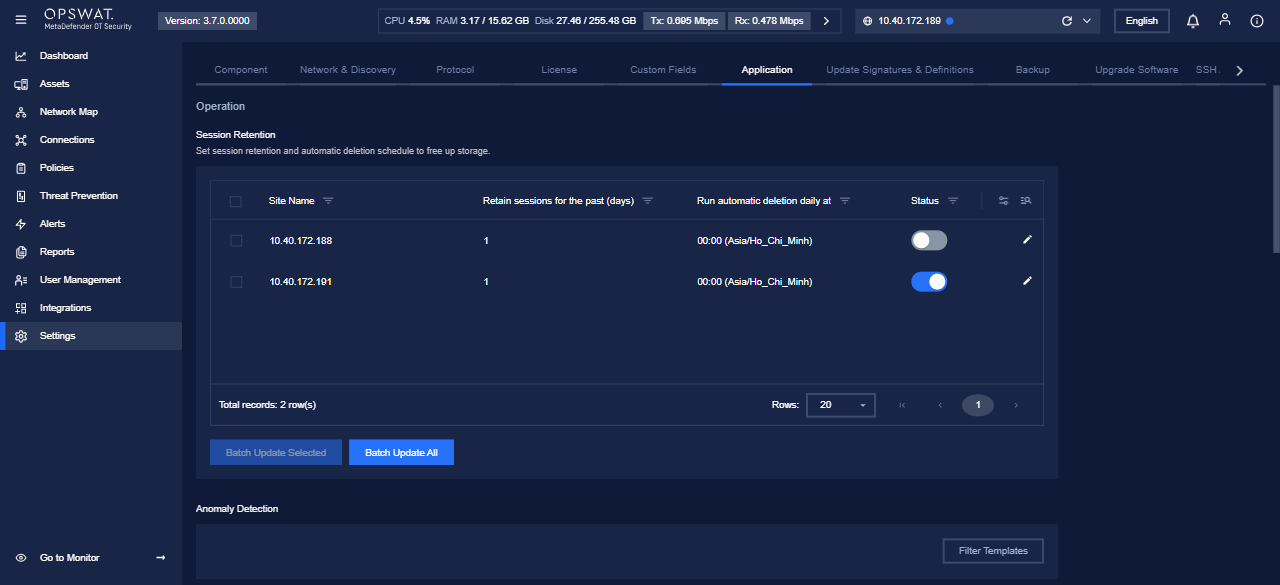
4. Settings — Application tab
The Application tab stacks several blocks vertically: Operation (Session Retention, then Anomaly Detection), then System Setting. The main content often lives in an inner scrollable panel (not only the browser window). Scroll that panel (or use Page Down after clicking inside the content) until you have seen Session Retention, Anomaly Detection, and all System Setting subsections.
4.1 Operation — Session Retention
Purpose: Control how long session/flow data is retained per site and when scheduled deletion runs to free storage.
Field guide
Site Name — The site this row applies to.
Retain sessions for the past (days) — How many days of data to keep before it becomes eligible for deletion.
Run automatic deletion daily at — Local time (with timezone) when the cleanup job runs.
Status — Toggle automatic deletion on or off for that site.
Row edit (pencil) — Change values for one site.
Batch actions
Select one or more rows with the checkboxes (or use Batch Update All).
Click Batch Update Selected or Batch Update All after editing eligible rows.
Confirm prompts if the product asks for validation.
Best practice: Align retention with compliance needs and monitor Disk space check (section 4.4) so the enterprise disk does not fill unexpectedly.
4.2 Operation — Anomaly Detection
Purpose: Turn anomaly detection on or off and associate it with site and sensor pairs (exact behavior depends on enabled templates).
Steps
Scroll the Application content until the Anomaly Detection heading is visible.
Optional: click Filter Templates to limit which template rows are shown.
Use the Enable Anomaly Detection control per row (and expand rows if the UI provides a chevron for more detail).
Review Site and Sensor columns so the correct sensor under each site is targeted.
Click Save when the button becomes active; wait for success confirmation.
Note: If Save stays disabled, no change was detected or a prerequisite (e.g. permission) is missing.
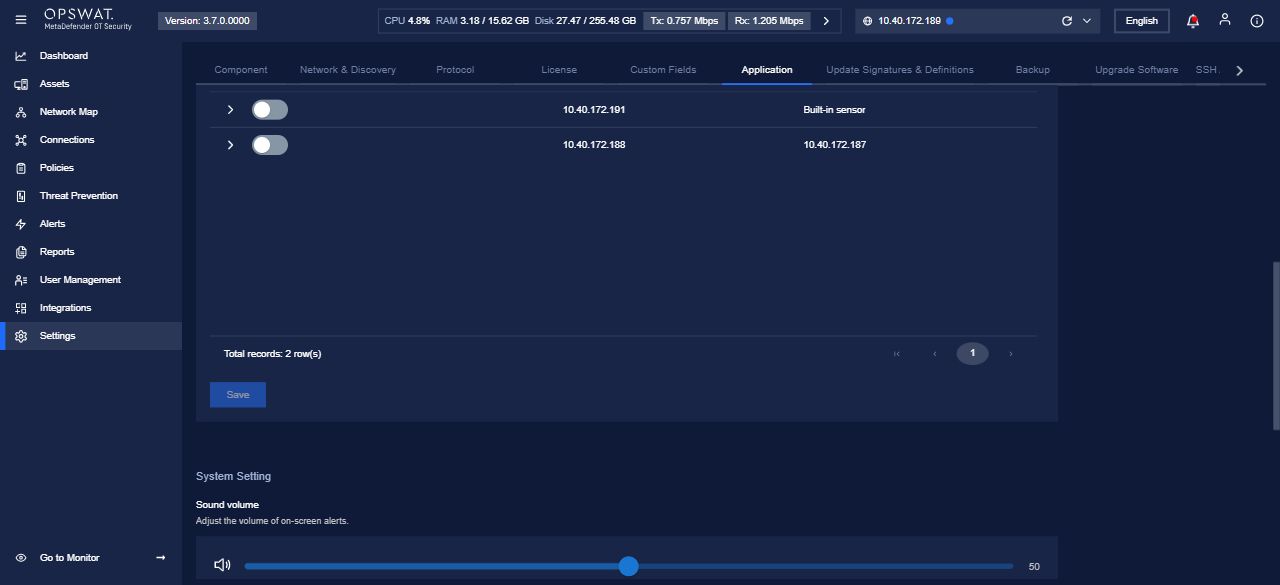
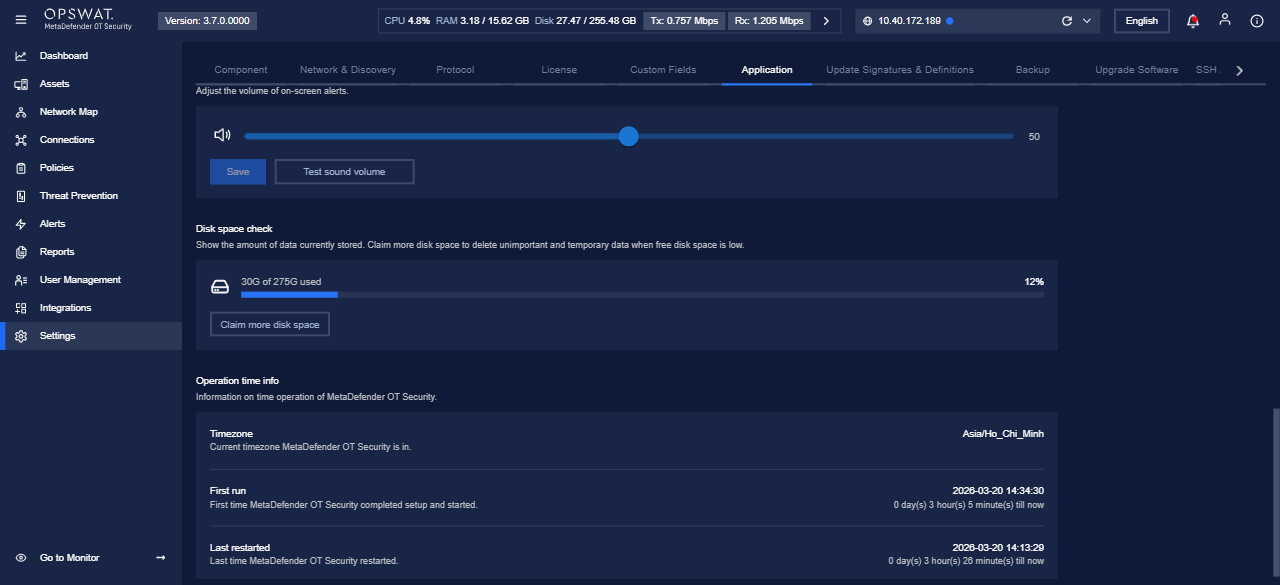
4.3 System Setting — Sound volume
Sets loudness for on-screen alerts. Drag the slider, click Save, then use Test sound volume from a workstation that can play audio from the browser session.
4.4 System Setting — Disk space check
Shows approximate stored data vs capacity. When space is low, click Claim more disk space to start the product workflow that removes safe-to-delete temporary or non-critical data. Plan capacity upgrades if usage stays high after cleanup.
4.5 System Setting — Operation time info
Read-only reference for support:
Timezone — Enterprise UI timezone.
First run — When setup first completed.
Last restarted — Last application restart (correlate with maintenance windows).
5. Other Settings tabs (enterprise)
Depending on your license and version, you may also see:
Network & Discovery — discovery intervals, interfaces, and related network options.
Protocol / License / Custom Fields — protocol handling, entitlement, and metadata.
Update Signatures & Definitions — threat/content update channels and schedules.
Backup / Upgrade Software / SSH Access Management — backup/restore, upgrades, and secure access.
My Account — password and personal preferences where applicable.
Open each tab and read the on-page help text; dangerous operations usually require confirmation.
6. Troubleshooting
Missing Settings tabs — You are probably on a site or sensor context; switch region to Enterprise.
Sensor never connects — Ping/route from enterprise to sensor IP, verify ports, and check local firewall on the sensor appliance.
Save disabled — No change was made, or a required field is invalid; correct the form and try again.
Disk warnings — Use Claim more disk space or reduce retention in Session Retention.
Application tab looks short — Scroll the inner settings panel; Session Retention, Anomaly Detection, and System Setting are stacked below the fold.