Within the My OPSWAT Central Management Console, there are ways to review reported SDP sessions and protected application access.
Dashboard: Overview and Secure Access
The Dashboard section of the My OPSWAT Central Management console will provide a quick overview of SDP sessions. These metrics will change in real-time and provide insight on active and most recent connections.
Overview:
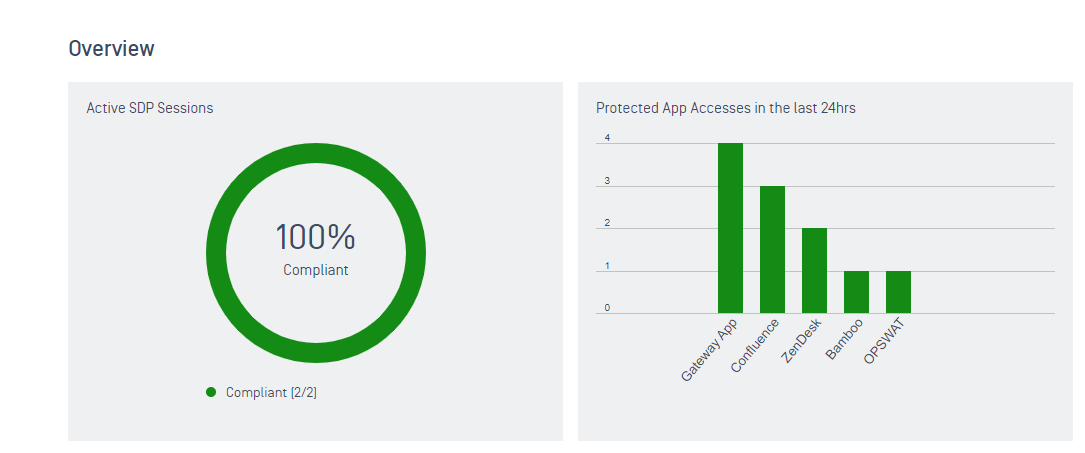
Navigate to Dashboard -> Overview.
In the upper left-hand corner, there are two metrics:
Active SDP Sessions indicate the current number of active SDP sessions initiated.
Protected App Accesses in the last 24hrs indicate the application activity within the past twenty-four hours.
Secure Access:
Navigate to Dashboard -> Secure Access.
This page consists of four metrics:
Sessions Blocked indicate the number of sessions blocked from accessing specific applications along with a reason a device was blocked.
Sessions Blocked by Application indicate the number of sessions blocked from accessing specific cloud applications in the last twenty-four hours.
Protected Applications by Access Mode indicate the number of cloud applications with the corresponding mode that have been set in the last twenty-four hours.
Trends of Blocked Sessions indicate the trend of blocked sessions from accessing cloud applications over the last twenty-four hours.
Activities: Access and Gateway Session Logs
Activities section provides a more filtered and drilled-down perspective on SDP sessions. It allows console users to see what applications end-users are accessing, and what gateways they are using to establish their SDP sessions.
Access Logs:
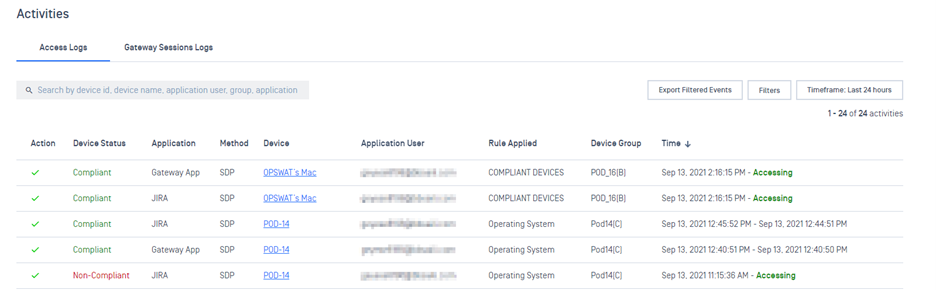
Navigate to Secure Access -> Activities -> Access Logs.
This page displays a table of device and application information relevant to SDP activities:
Action indicates what action category the device is matches based on the rules set in My OPSWAT Central Management (Allowed, Blocked, Monitored (Block), Monitored (Allow), Temporary Allowed).
Device Status indicates what compliance status the device falls under.
Application indicates what protected application the end-user is accessing within the activity entry.
Method indicates what type of protection method is being used (SDP and IDP).
Device indicates what device is being used by the end-user to access the application.
Application User indicates what end-user is initiating this activity entry.
Rule Applied indicates what Secure Access rule is being applied to the device that sets the action category.
Device Group indicates what group the device in-use is associated with.
Time indicates the starting and ending time of the activity entry. While in active use, the end time will be shown as “Accessing”.
To filter by activity, select the ‘Filters’ button and check off the desired Action categories or protection method.
Console users can also use the search bar to search by device id, device name, application user, group, or application.
To filter the activity based on timeframe, select ‘Timeframe’ and users can set the timeframe to: Last 1 hour, Last 12 hours, Last 24 hours, or Custom. *
To export these logs (with filers applied), press ‘Export Filtered Events’ and submit your PIN. This will trigger the download of the filtered events as a CSV file.
Gateway Session Logs:
Navigate to Secure Access -> Activities -> Gateway Session Logs.
This page displays a table of device and gateway information relevant to SDP activities:
Status indicates whether the connection to the gateway is active or disconnected.
Device indicates what device is establishing a connection with a given gateway.
User indicates what end-user is establishing a connection with a given gateway.
Device Status indicates what compliance status the device falls under.
Gateway indicates what gateway the end-user is attempting to connect to.
Device Group indicates what group the device in-use is associated with.
Time indicates the starting and ending time of the activity entry. While in active use, the end time will be shown as “Active”.
To filter by activity, select the ‘Filters’ button and check off the status or device status.
Console users can also use the search bar to search by user or device name.
To filter the activity based on timeframe, select ‘Timeframe’ and users can set the timeframe to: Last 1 hour, Last 12 hours, Last 24 hours, or Custom. *
To export these logs (with filers applied), press ‘Export Filtered Events’ and submit your PIN. This will trigger the download of the filtered events as a CSV file.
*Custom field can only be set as far back as the account’s ‘Data retention length’. This can be reviewed in Settings -> Global -> Device Data, under Data Retention.