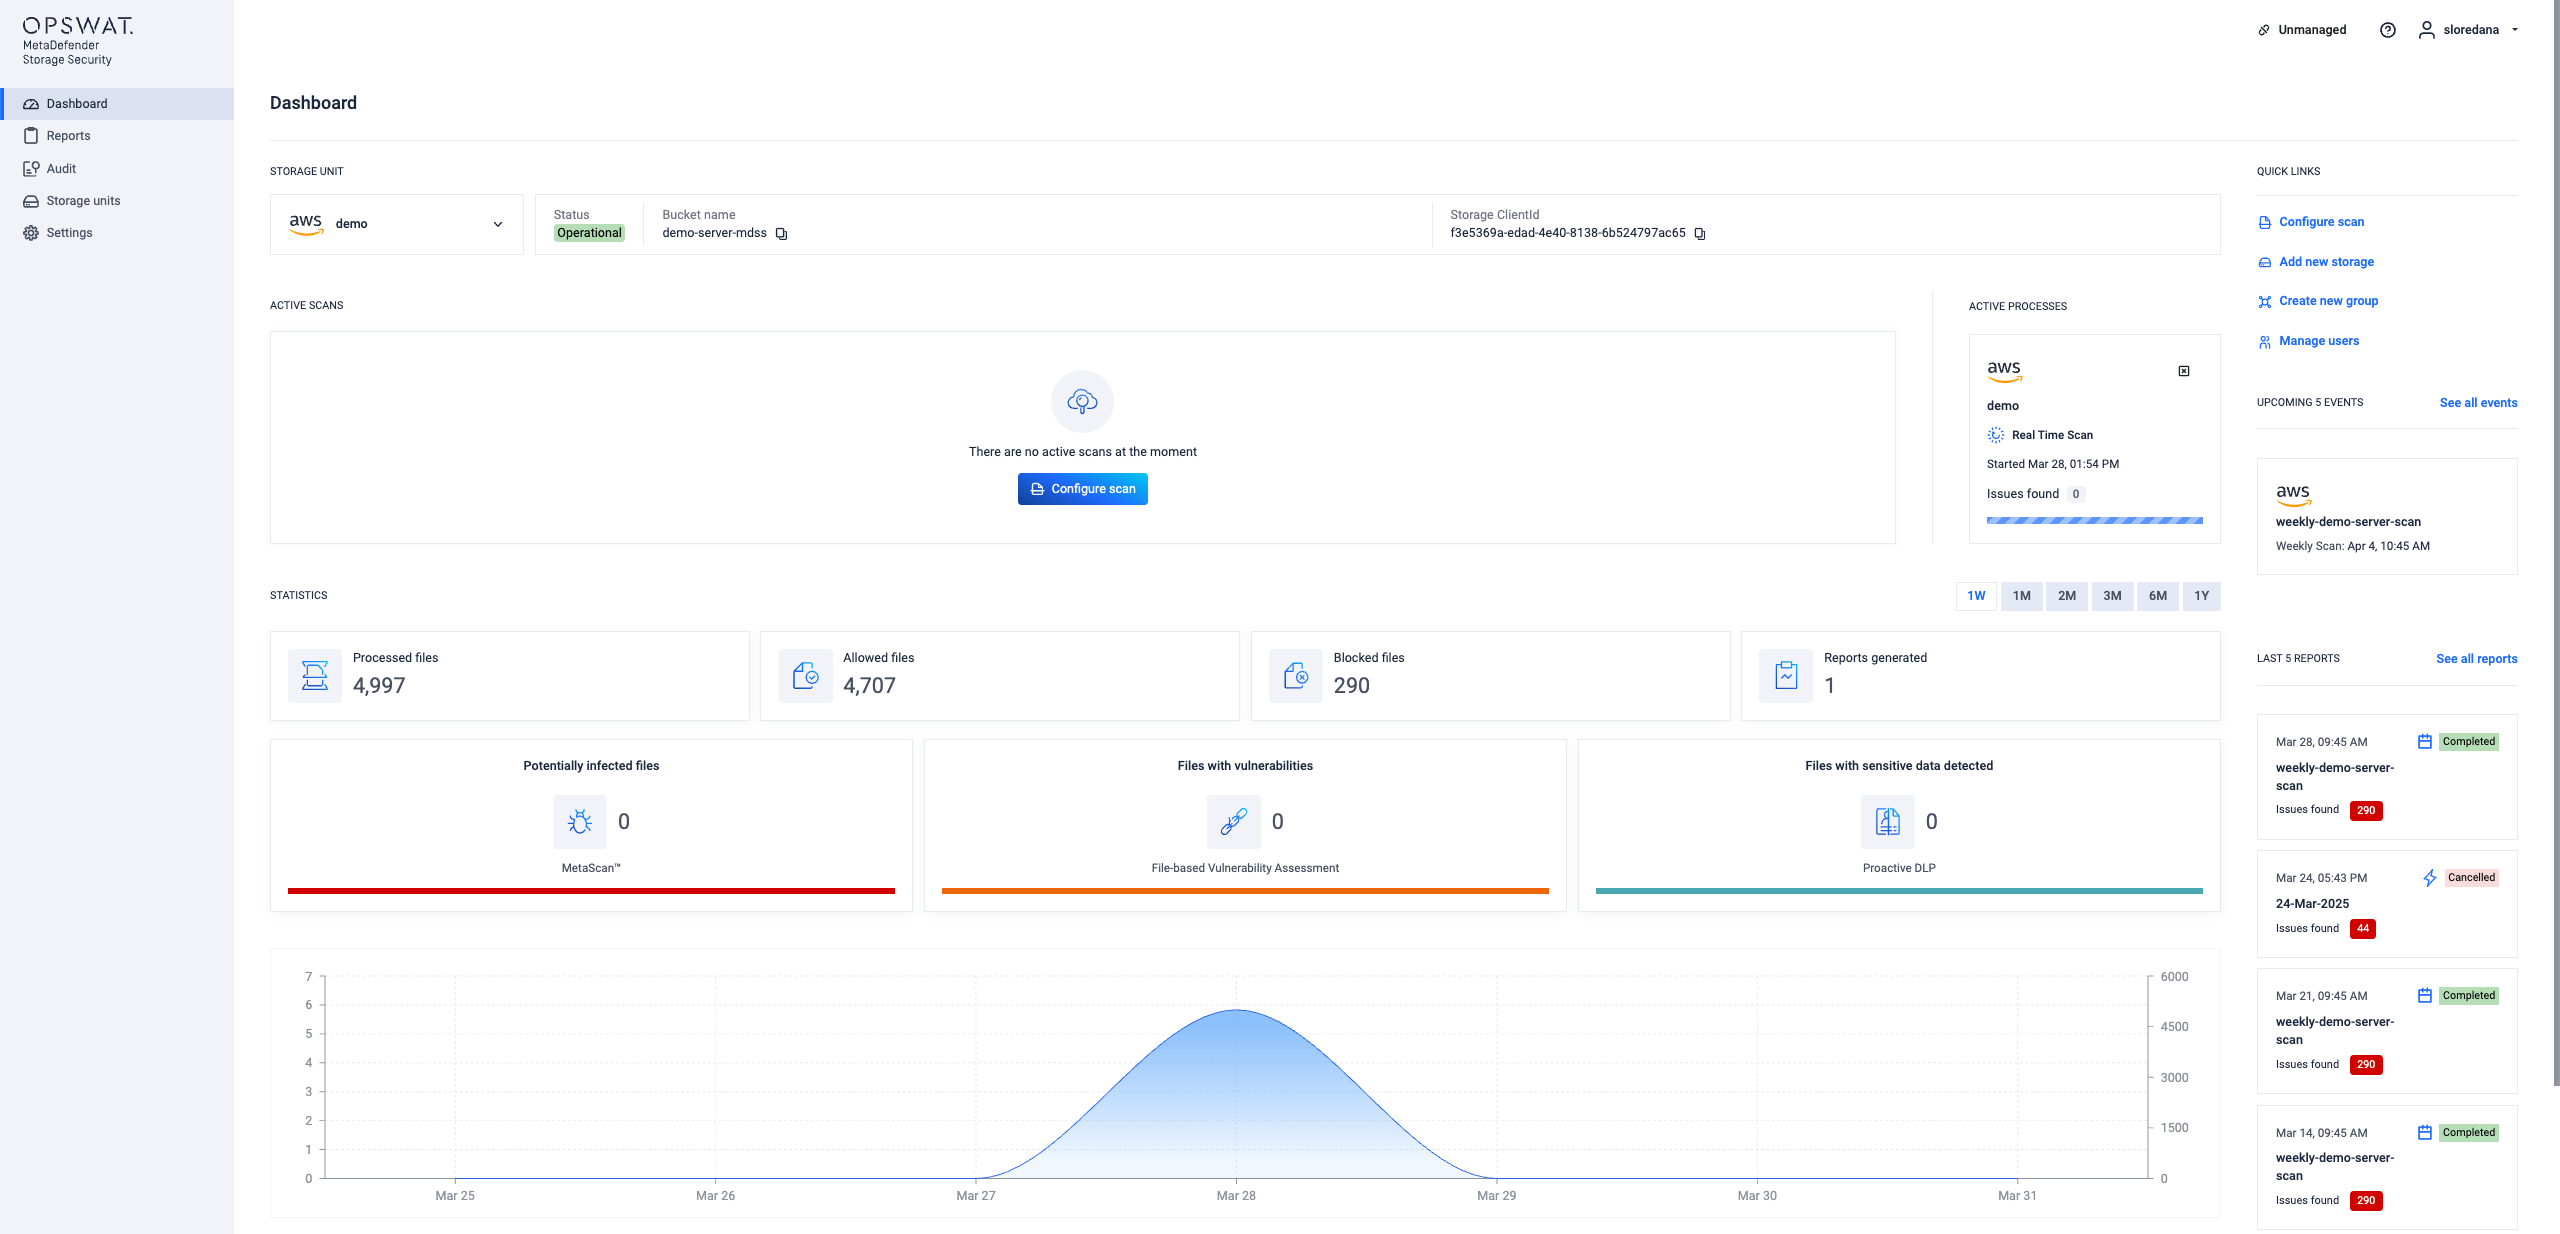
The MetaDefender Storage Security dashboard is the page where you can see an overview of your storage and find information about file processing and usage statistics as well as details about currently running processes or upcoming ones.
Key Features at a Glance
- The dashboard begins with a dynamic activity feed, displaying the most recent scan results, file processing statuses, and any detected threats. This immediate visibility allows you to quickly assess the current state of your storage security.
- Quick access to essential configuration settings, user management, and other key sections of MetaDefender Storage Security is available through the navigation menu on the right. Customize your setup, manage users, and fine-tune your security policies directly from this central location.
- Gain a quick understanding of your system's performance with key statistics displayed prominently in the center. See the total number of files processed, detected threats, and other critical metrics at a glance.
- Dive deeper into file processing details with a breakdown of processed, sanitized, and blocked files. Understand the efficiency of your security measures and identify any potential bottlenecks.
- Monitor threat detection effectiveness with clear visualizations of potentially malicious files, permanently unavailable files, and possible threats.
- Track system performance over time with an interactive graph. Analyze file processing trends and identify any performance anomalies.
- Access in-depth analysis of individual files, including threat assessment results and remediation actions. This granular view allows you to understand the specific threats detected and take appropriate action.
Why the Dashboard Matters
The MetaDefender Storage Security dashboard is designed to be your primary point of interaction with the system. It provides the essential information you need to:
- Stay informed about the real-time security status of your storage.
- Understand system efficiency and identify areas for optimization.
- Customize settings and policies to meet your specific security requirements.
- Quickly address detected threats and mitigate potential risks.
Dashboard Counters
Previously, the MetaDefender Storage Security dashboard provided a consolidated view of compliance and security metrics, offering insights into potential violations and threats. While these metrics remain critical for understanding your security posture, they are now presented in more detail within their respective technology sections: Multiscanning, Content Disarm and Reconstruction (CDR), and Data Loss Prevention (DLP).
Key Compliance and Security Metrics (Now Found in Dedicated Sections)
These categories, though no longer directly visible on the main dashboard, are still essential for comprehensive security analysis and are now located within the dedicated sections for each technology:
Compliance Violations (DLP Section):
- PCI-DSS (Payment Card Industry Data Security Standard): Tracks files containing Credit Card Numbers (CCN).
- HIPAA (Health Insurance Portability and Accountability Act): Identifies files containing protected health information (e.g., full name, address, date of birth, phone number, email, SSN, bank account, passport).
- GDPR (General Data Protection Regulation): Monitors files with personally identifiable information (PII) as defined by GDPR (e.g., full name, address, date of birth, phone number, email, bank account, passport).
Security Alerts (Multiscanning and Vulnerability Assessment Sections):
- Malware: Displays the number of potentially dangerous files detected by our multi-scanning technology.
- Vulnerabilities: Shows the number of files with known vulnerabilities identified by our File-Based Vulnerability Assessment engine.
PII Data (DLP Section) tracks files containing personally identifiable information (e.g., full name, bank account, passport, email, SSN).
Why These Metrics Still Matter
- Demonstrating adherence to industry regulations.
- Identifying potential malware and vulnerabilities.
- Protecting sensitive information from unauthorized access.
Where to Find These Metrics Now:
For detailed information on these metrics, please click on each dedicated sections for: Multiscanning, CDR and DLP.
Please check the MetaDefender Core sample regular expression page for a list of rules that are being used to match full names, US addresses, birth dates, etc.
The small arrows below each category shows you a percentage increase or decrease based on the previous scan.
Processing Overview
You can select to view data for the last week, month or even the last year. The height of the bar represents the volume of files processed by MetaDefender Storage Security. Hover over it to see more details:
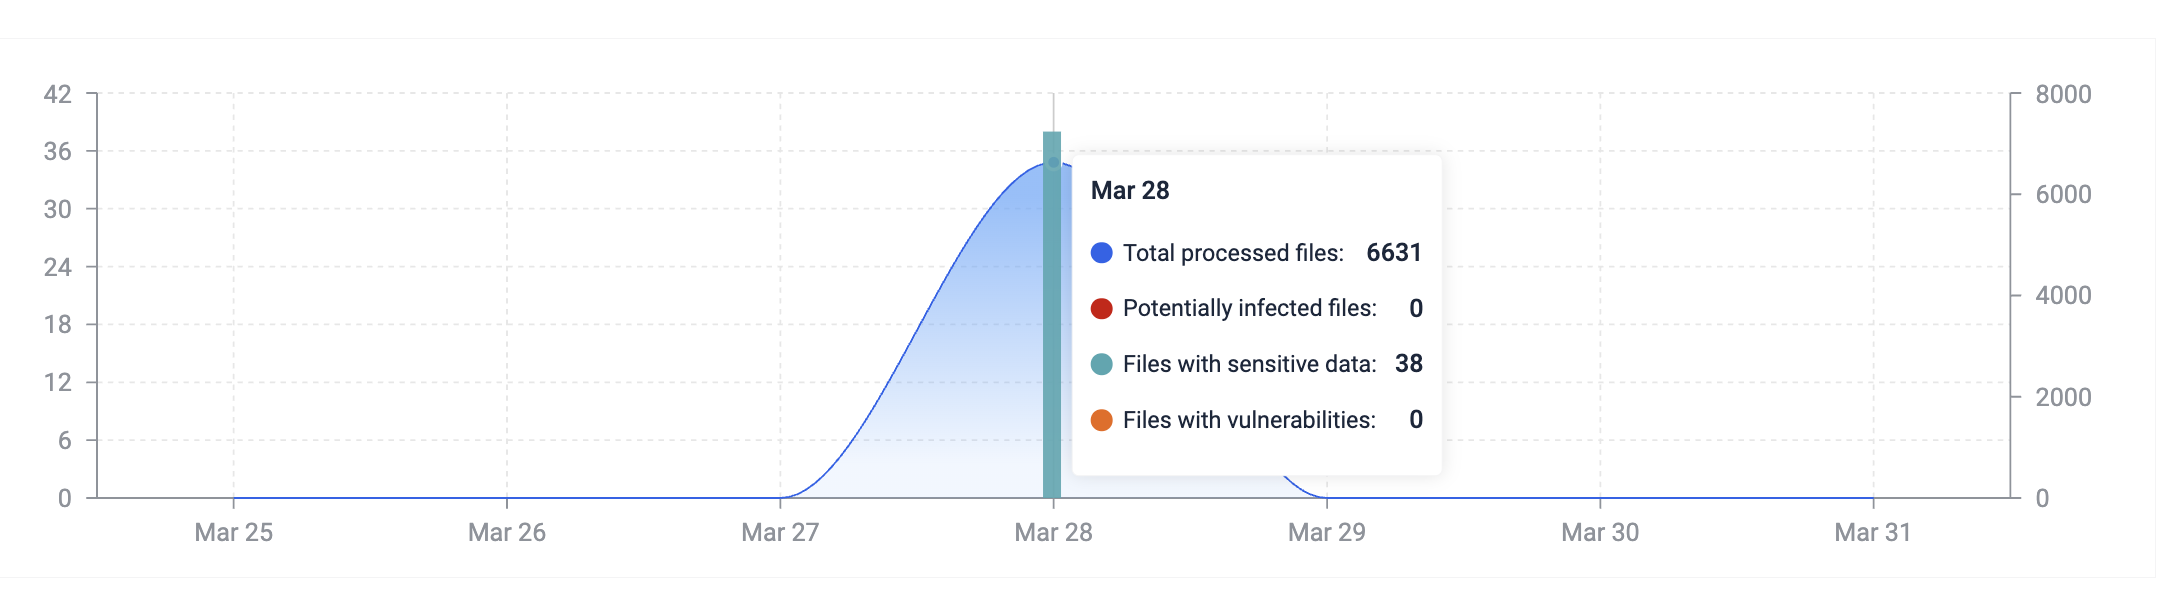
The processed quantity field represents the total amount of data processed with MetaDefender Storage Security. This quantity will exceed your actual storage data if you have triggered more than one process in the defined time unit (day or month). That is because every time you process a file this quantity will be increased even if you’ve processed the same file multiple times.
The number of suspicious files, as well as the counters on the top of the page, represent unique files. If the hash of the file has not changed, MetaDefender Storage Security will only count it once.
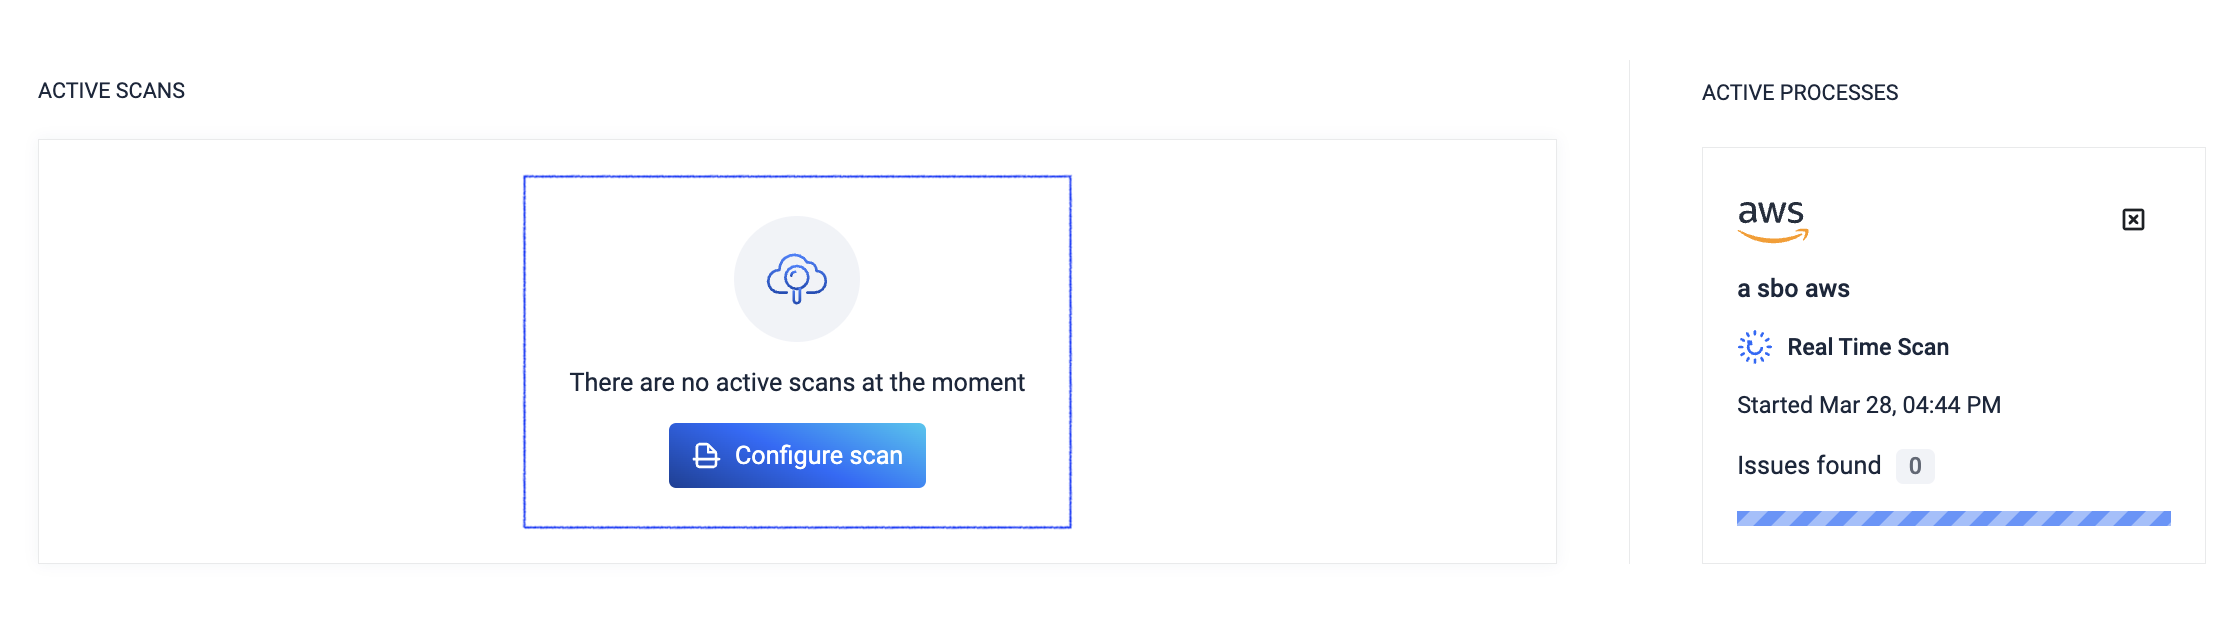
Active processes
The right-side area of the dashboard allows you to trigger an instant process of your storage. To do this, click Start process and give this process a name so you can easily identify later.
This process represents an Instant process and will produce a report that has ‘Instant’ as a type. This is useful for your to differentiate between scheduled and instant processes.
Please note that this might take a while if your storage contains a significant amount of data. While it is possible for one (or more!) scheduled processes to start while an instant process is running we recommend to avoid that for large storage units.
If that happens, however, you will see a list of your currently running processes in the right-side area for the dashboard and be able to switch between them.
As you can see in the picture below, when a process is in progress the panel will display basic information about this process like the number of pending, blocked or failed files.
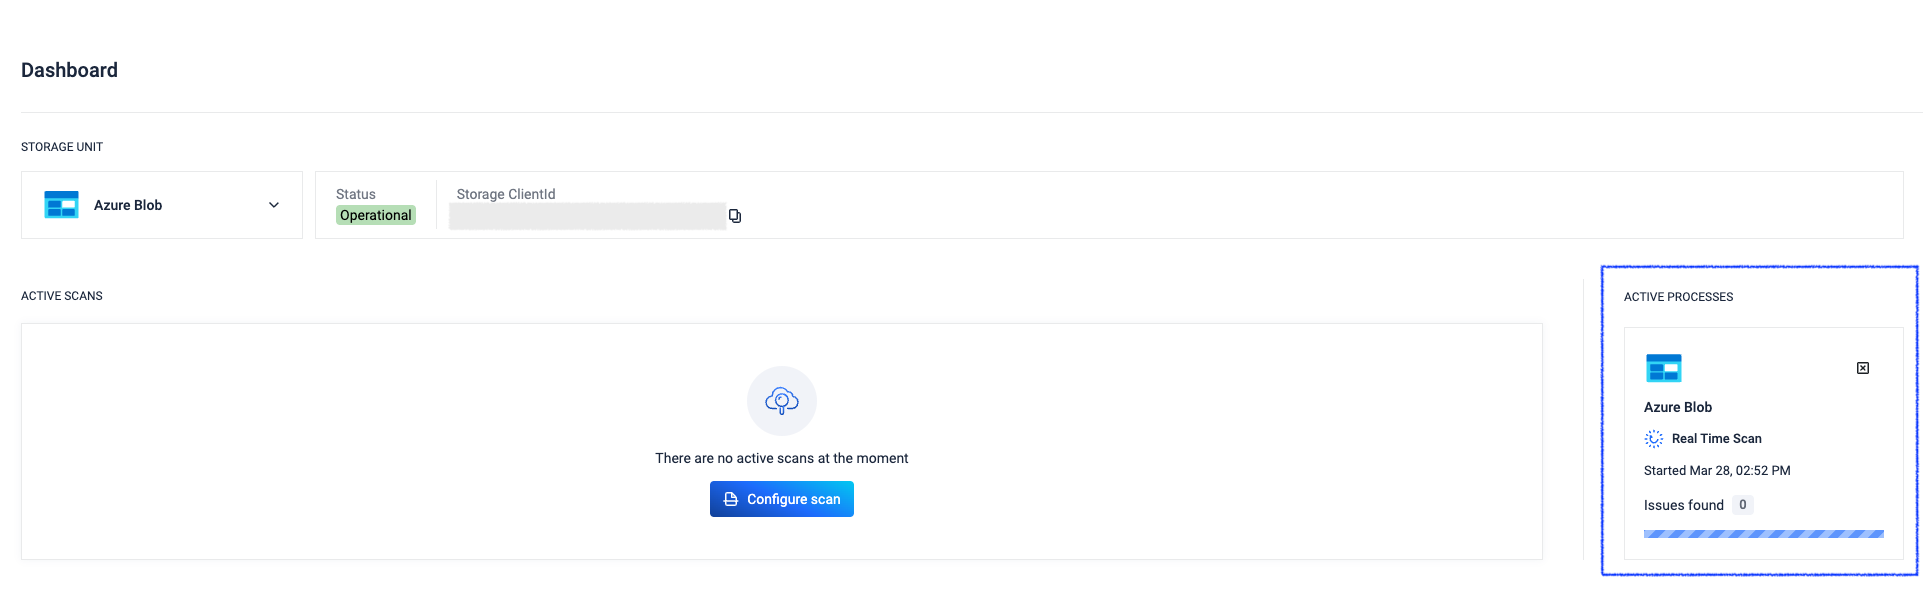
Click Process details if you want to see more information about this process. You will be redirected to a page that contains the following information:
- The progress of the discovery
- Progress of the overall process
- Individual file processing progress
Ongoing process details
When clicking Process details you will be redirected to the ongoing process page:
Here you can find the information we previously mentioned as well as the time elapsed since this process was started. Click back if you want to go back to the dashboard.
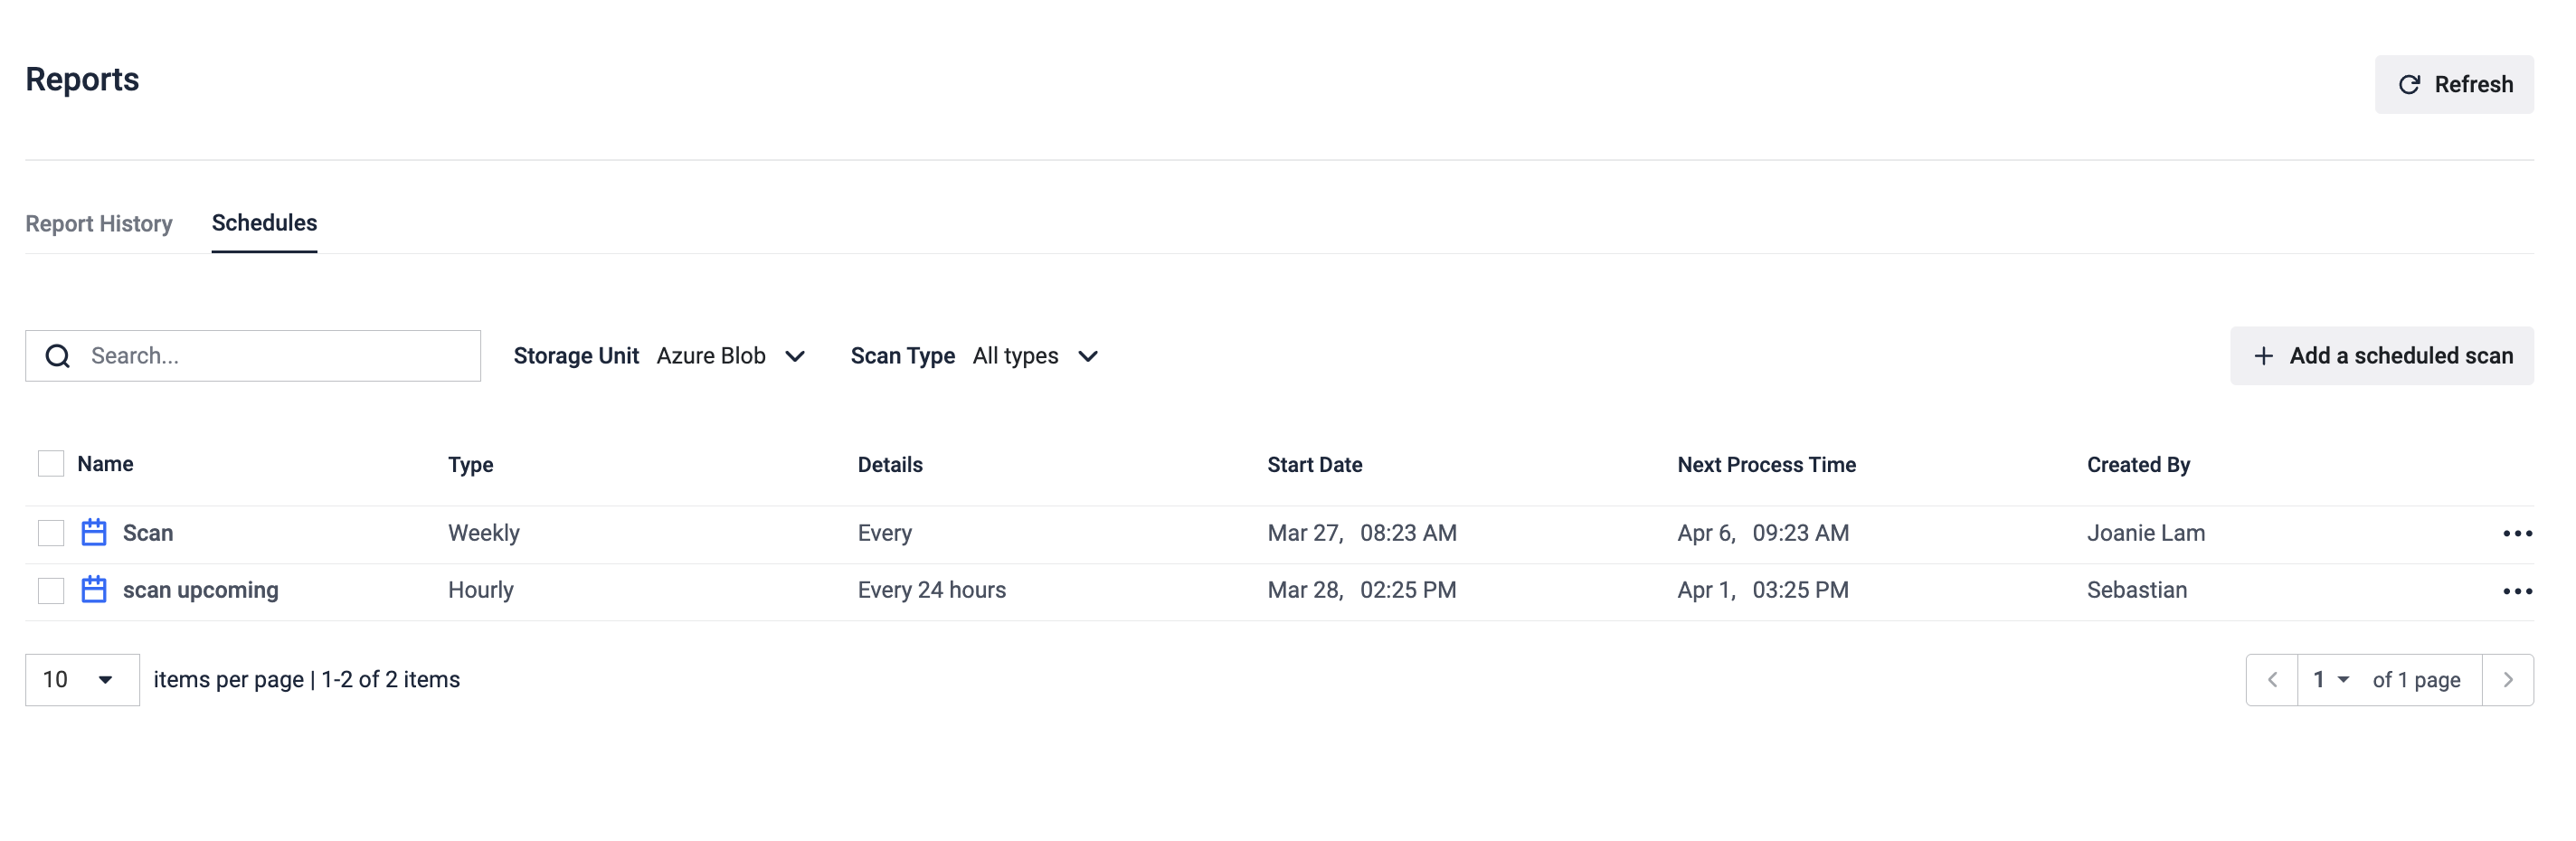
Real time processing and upcoming processes
On the dashboard page, if you scroll down, you will find more information about real time processing and upcoming scheduled processes. This area, like the whole page, is updated in real time so you can always know what’s happening.
Real time processing requires a lot of internal communication. This could impact the performance of other scans
Starting real time processing and other type of scans in parallel with remediations that modify the files in storage could trigger a loop scanning.
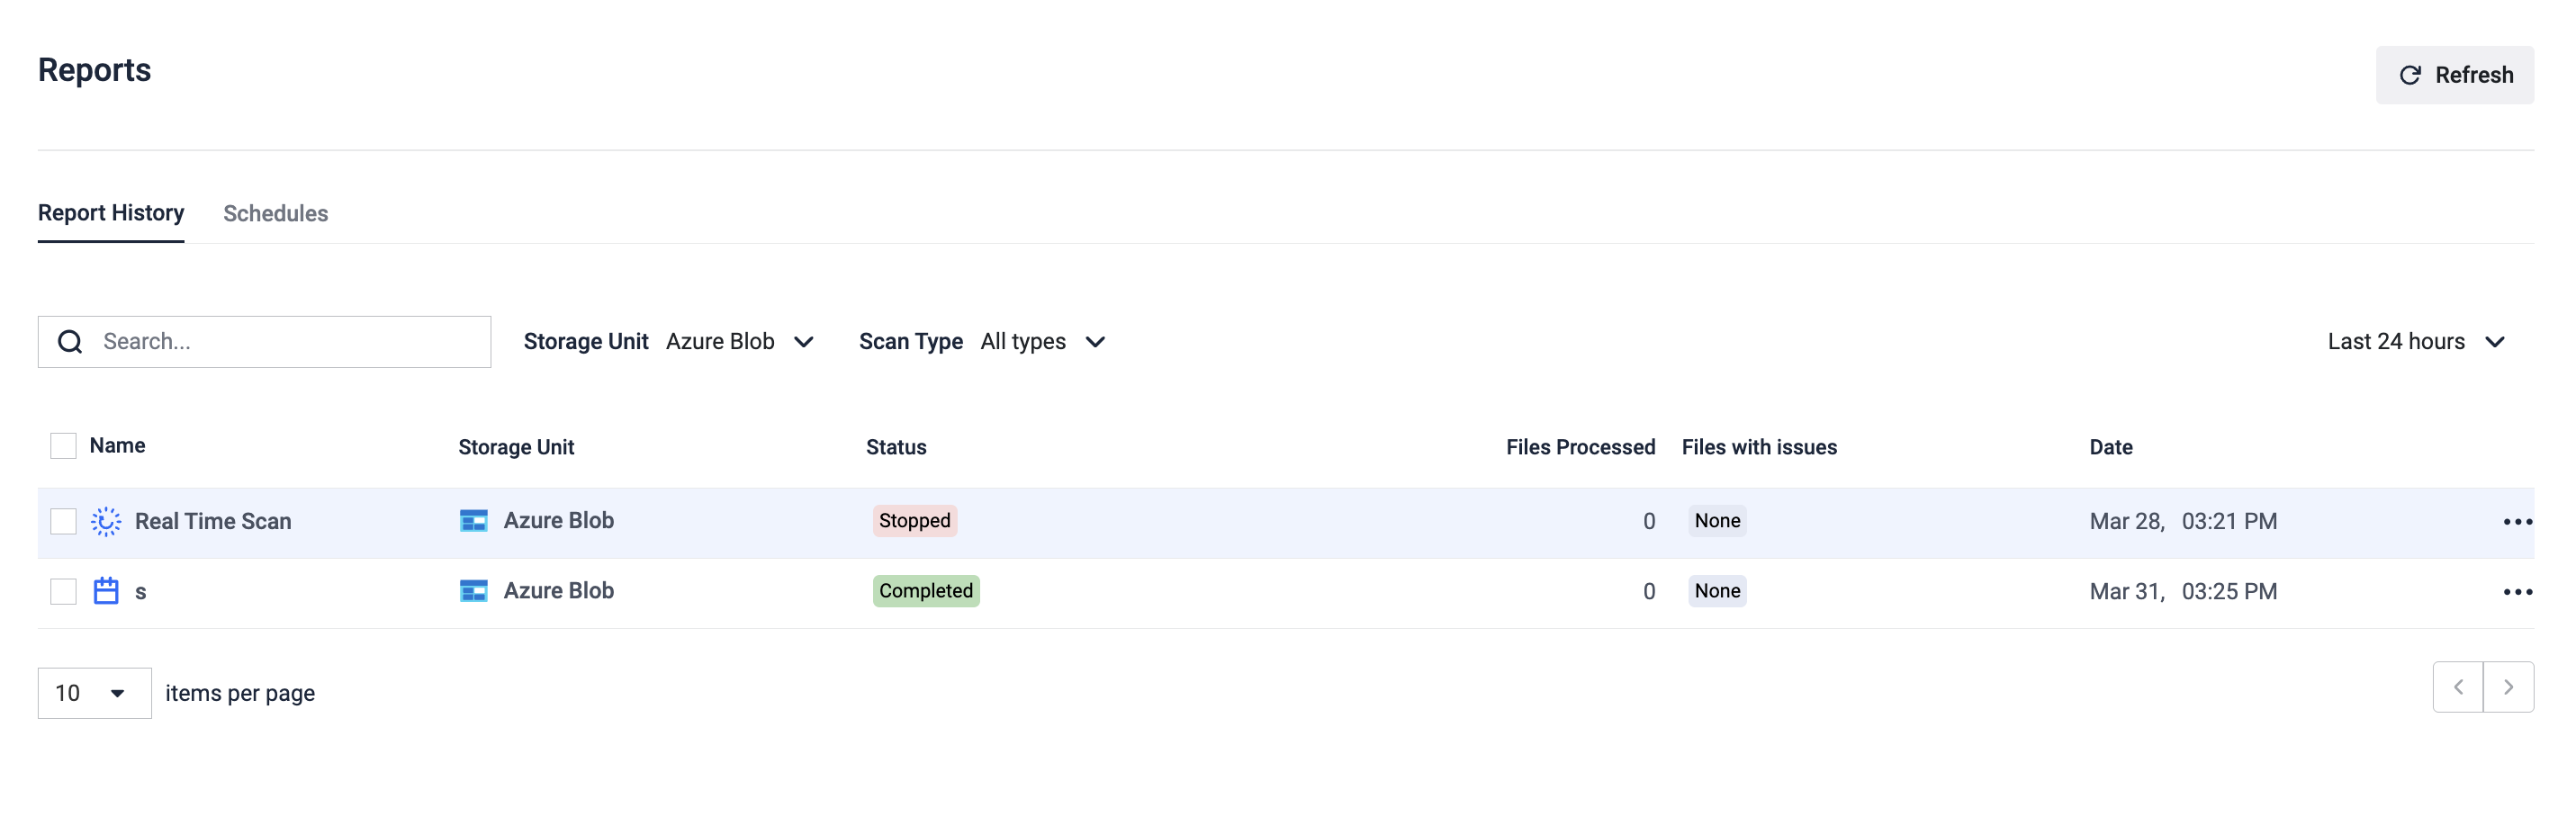
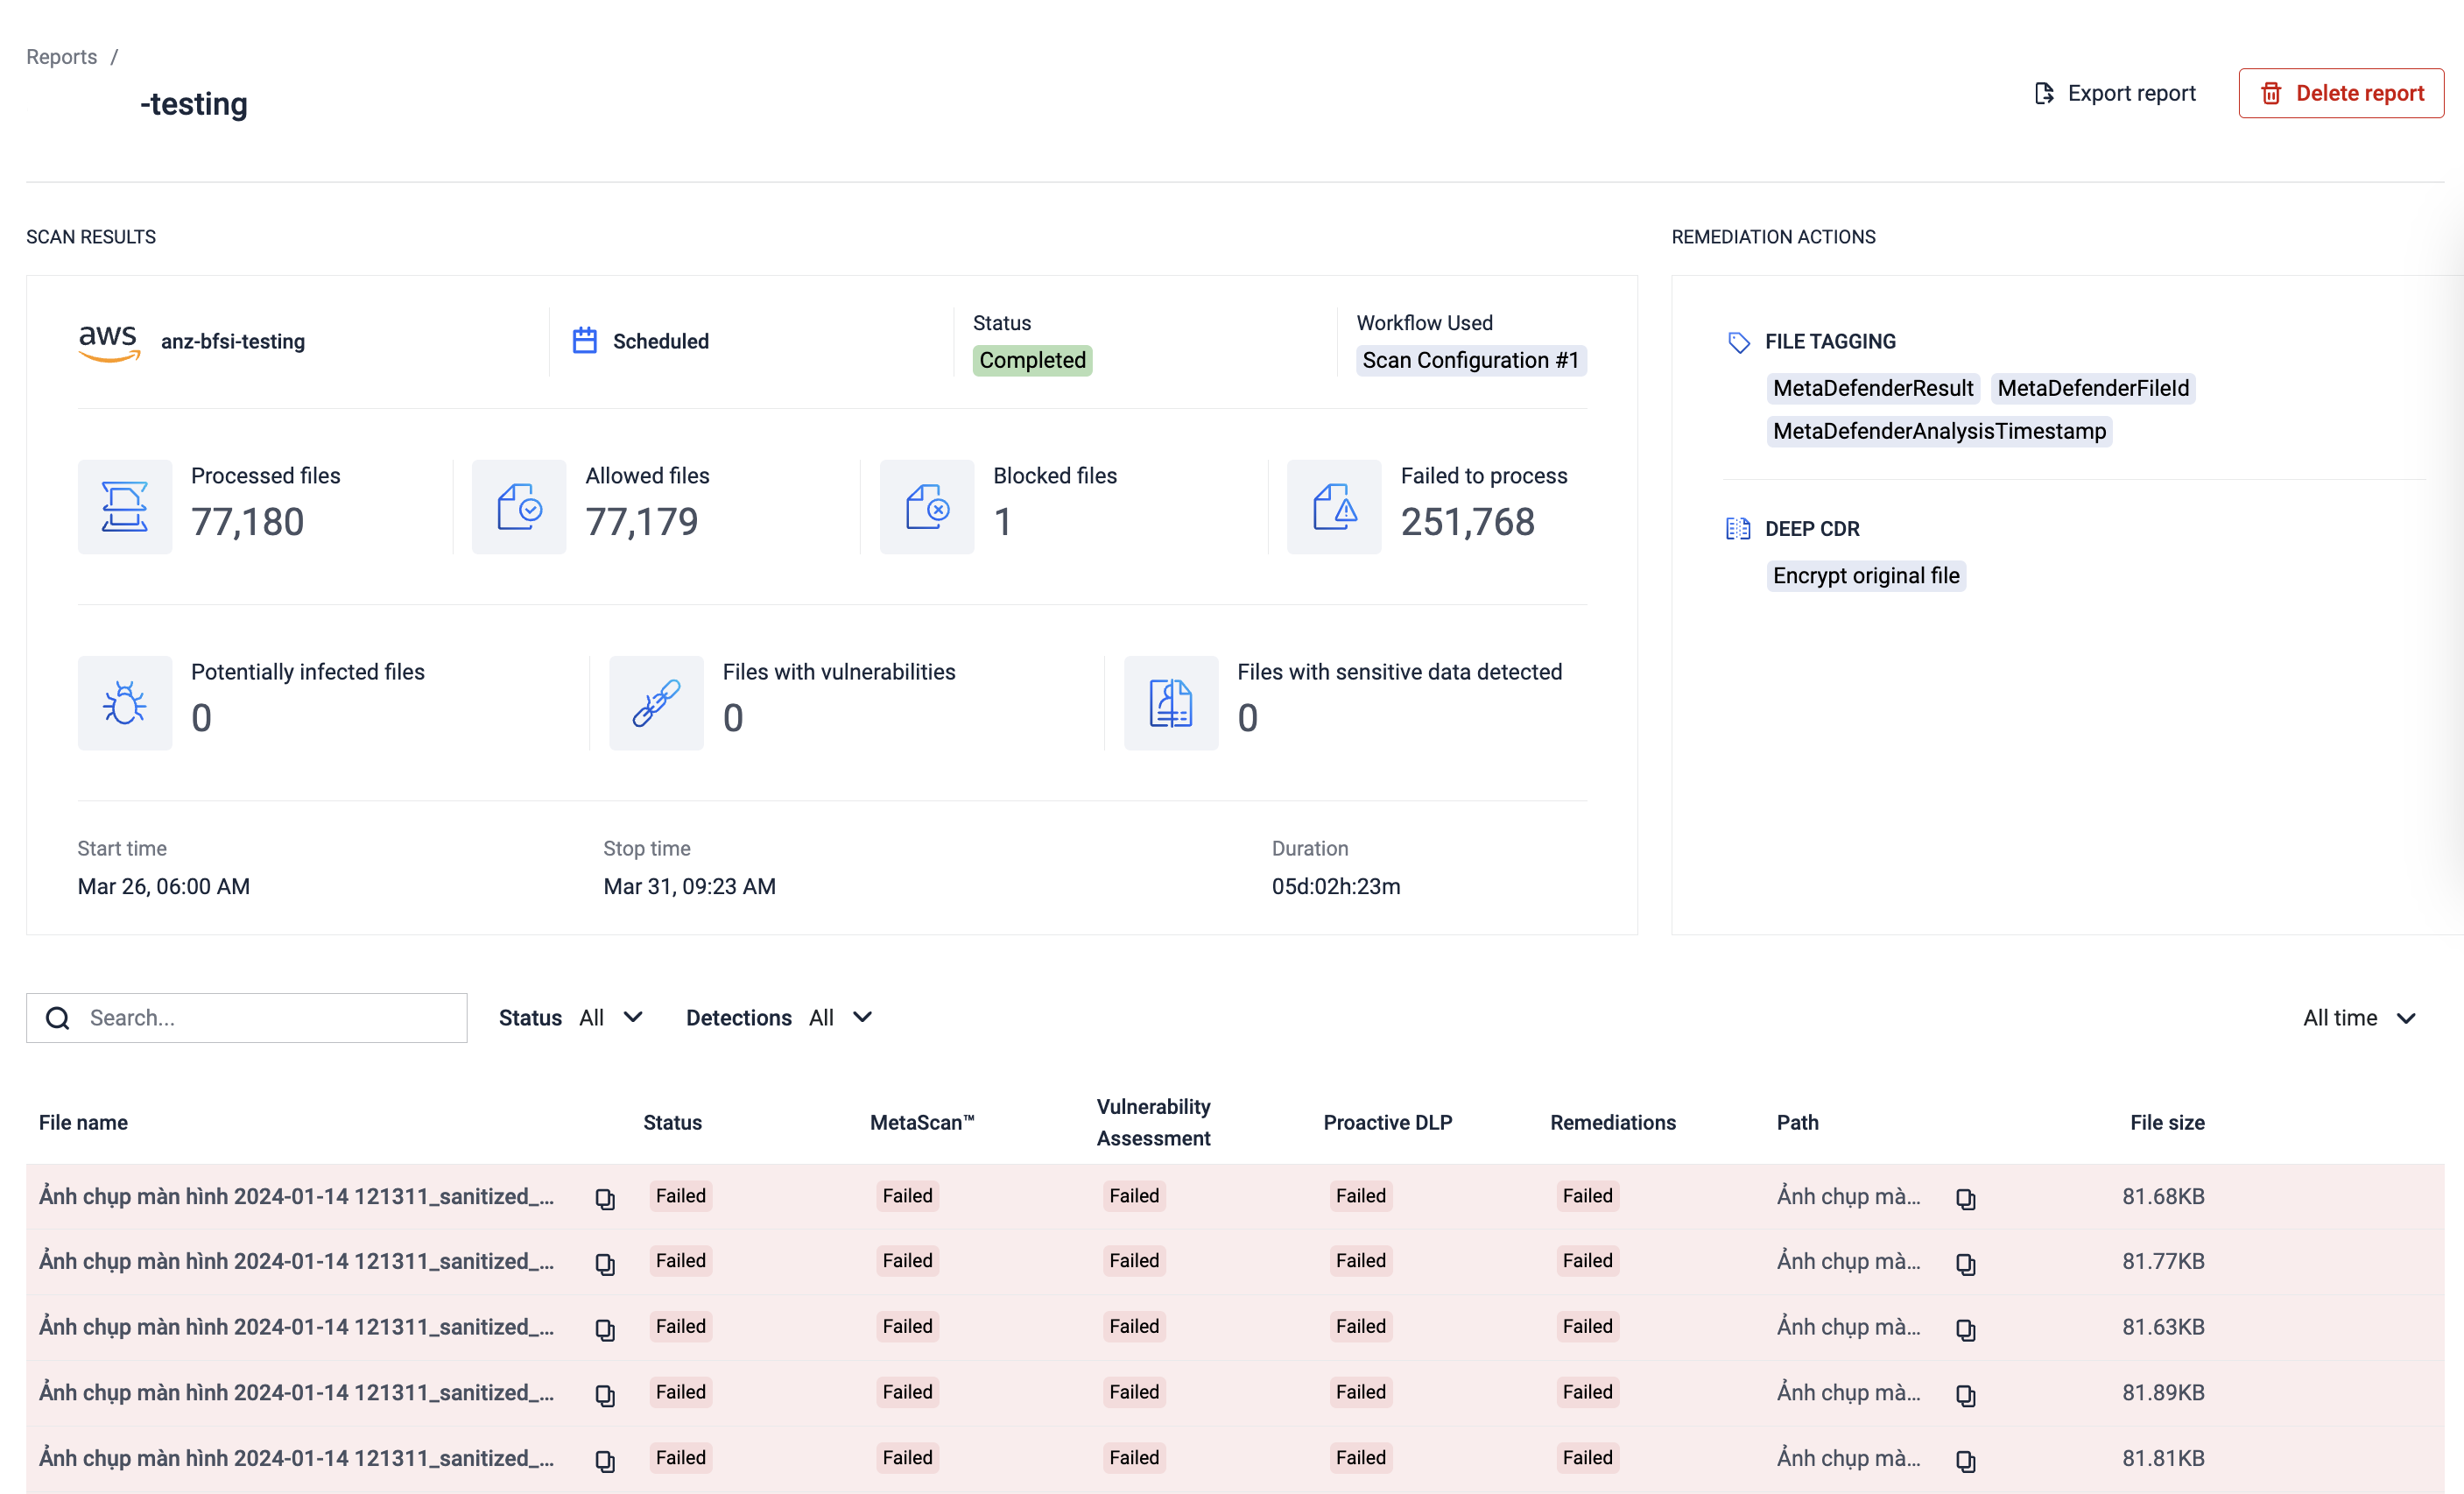
Last 5 reports
At the bottom of the page, there is a list of past reports that you can click in order to find more information about a specific report.