What is it?
Troubleshooting is a built-in health dashboard in MetaDefender Core. It runs automated checks on your deployment and shows the results in one place — so you can quickly see whether Core, its engines, database, and integrations are healthy, without digging through logs or running manual tests.
The page refreshes automatically in the background. You can also run a deeper on-demand scan when you need a full picture.
How to read the page
Overall status
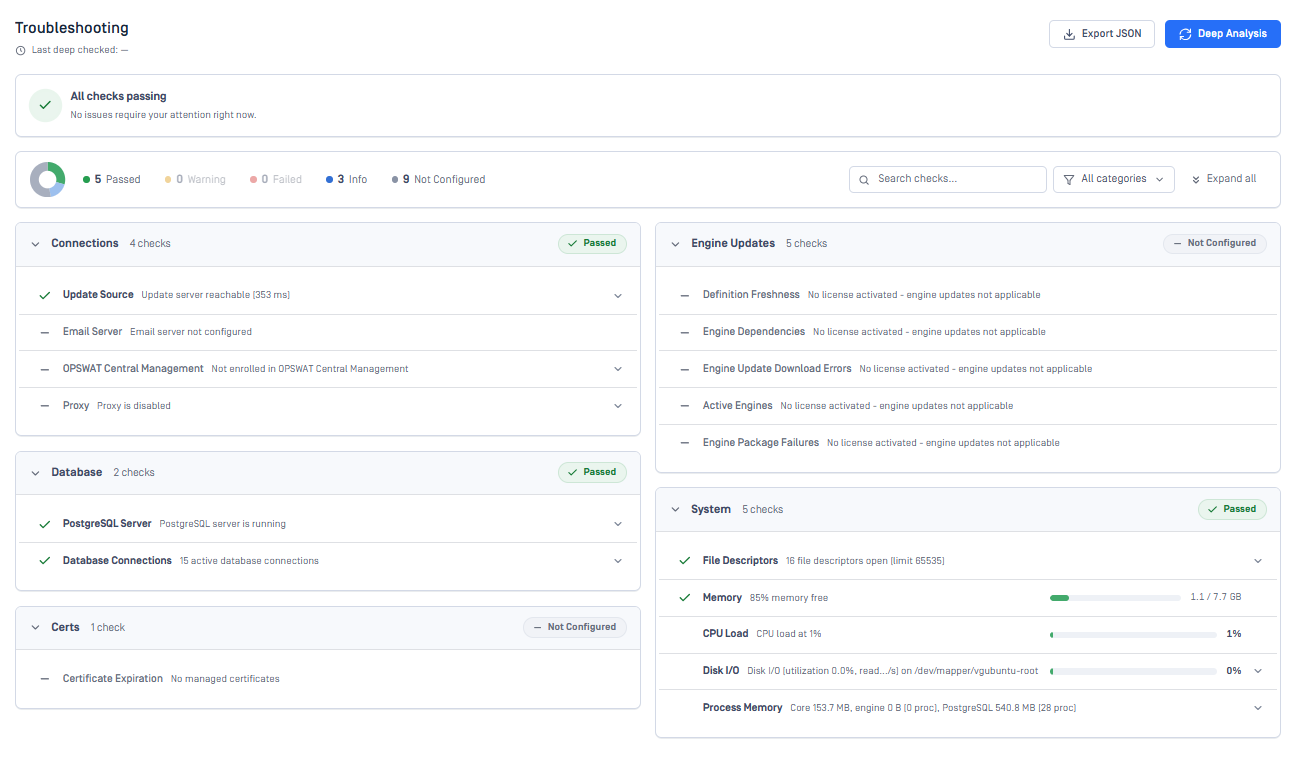
At the top, a summary banner shows the overall health:
All checks passing — nothing is failing or warning.
Warning / Failed — at least one check needs attention.
The donut chart and counts break down results:
Status | Meaning |
|---|---|
Passed | Check ran and the system looks healthy. |
Warning | Something works but could be improved. |
Failed | A real problem was found — review the message and remediation. |
Not Configured | An optional feature is not set up (e.g. email server, OCM). This is not a failure. |
For example, 11 Passed and 4 Not Configured with 0 Failed means the system is healthy. The gray “Not Configured” items are optional settings you have not enabled.
Categories
Checks are grouped by area. Expand a category to see individual checks and details.
Category | What it covers |
|---|---|
Connections | Update source, proxy, email server, OPSWAT Central Management (OCM) |
Engine Updates | Active engines, definition freshness, update download errors, dependencies, failed packages |
Database | PostgreSQL status, connection count (Full run adds size and maintenance checks) |
System | CPU, memory, disk I/O, process memory (Core, engines, PostgreSQL) |
Certs | Managed certificate expiration |
Disk Space | Disk usage across Core data paths (Deep Analysis only) |
Each check shows a message (what was found) and, when applicable, remediation steps to fix a failure.
Automatic vs. Deep Analysis
Automatic checks | Deep Analysis | |
|---|---|---|
When | Every ~5 minutes in the background | On demand — click Deep Analysis |
Scope | Quick/lightweight checks | Full set, including disk space and deeper database checks |
Use when | Day-to-day monitoring | Investigating an issue, before/after changes, or for support |