
Enterprise – Components (Component Management)
This page describes Settings > Component on the Enterprise node in MetaDefender OT Security. It lists every managed component (Enterprise, Sites, Sensors, built-in sensor) with health and capacity metrics.
Settings → Component: component list with throughput, CPU, RAM, and disk metrics.
How to open
Log in to the Enterprise web UI (HTTPS to the Enterprise IPv4).
Choose Go to Management if you are in Monitor mode (floating alert strip).
In the left navigation, click Settings (gear).
Ensure the Component tab is selected (first tab in the Settings area).
Direct URL pattern (example): https://<enterprise-ip>/settings — The Component tab shows Component Management.
What you see
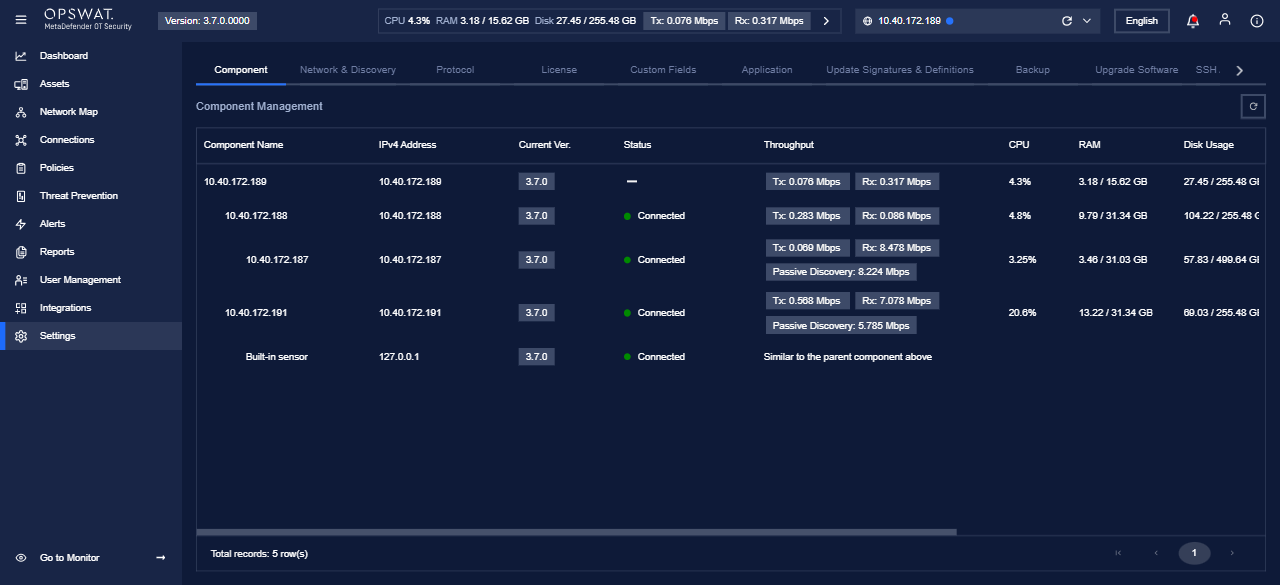
Settings tabs (Enterprise)
Along the top of Settings, tabs include (order may vary by version):
Component (this page)
Network & Discovery
Protocol
License
Custom Fields
Application
Update Signatures & Definitions
Backup
Upgrade Software
Support Package
SSH Access Management
Asset Type
My Account
Component Management table
The main grid is titled Component Management. A refresh control shows the last updated timestamp (e.g. "Updated: …"). Columns typically include:
Column | Description |
|---|---|
Component Name | Display name (may match IPv4, site name, or Built-in sensor). |
IPv4 Address | Management address (built-in sensor may show |
Current Ver. | Software version reported by the component. |
Status | Connection state (e.g. Connected) or indicator for the Enterprise/root row. |
Throughput | Tx/Rx Mbps; some sensors also show Passive Discovery throughput. |
CPU | CPU utilization (%). |
RAM | Used / total memory. |
Disk Usage | Used / total disk. |
Description | Optional text (often "-"). |
Last Updated | Timestamp of the last metrics refresh. |
Built-in sensor row
The Built-in sensor entry (loopback 127.0.0.1) may show throughput as Similar to the parent component above instead of raw Tx/Rx numbers, because it shares the parent sensor's traffic context.
Pagination
When many components exist, use the pagination control at the bottom ("Total records: N row(s)", page buttons).
Typical use cases
Verify all Sites and Sensors are Connected after deployment or network change.
Compare Current Ver. across the fleet before or after an upgrade.
Spot capacity pressure via CPU, RAM, or Disk Usage.
Review Throughput and passive discovery load on sensor nodes.
Related documentation
Developer Hub (v3.7.0): Settings → enterprise-components (synced from this Confluence page; image embedded via API as data URI).
Source file in repo (CI/authors):
captures/enterprise-settings-component-management.png