
Site dashboard
The Dashboard provides a monitoring overview for a specific site in MetaDefender OT Security. This page is written for Site scope (for example 10.40.172.191) and not for sensor-only scope.
Open the dashboard
Step | Action |
|---|---|
1 | Open the MetaDefender OT Security web console URL provided by your administrator. |
2 | Sign in with your assigned account. |
3 | Stay in Monitor mode. If you are in Management, use Go to Monitor in the left panel. |
4 | In the left navigation, click Dashboard. |
5 | In the header scope selector, choose the target site (for example |
Header strip
Area | Purpose |
|---|---|
CPU / RAM / Disk | Shows appliance resource usage. |
Tx / Rx | Displays approximate transmit and receive traffic for the current scope. |
Scope selector | Must show the selected site for this page. If a sensor name is shown, switch back to the site before reviewing widget values. |
Language / Notifications / Account | Common operator controls for language, notifications, and account access. |
Main dashboard widgets (Site scope)
Widget | Purpose |
|---|---|
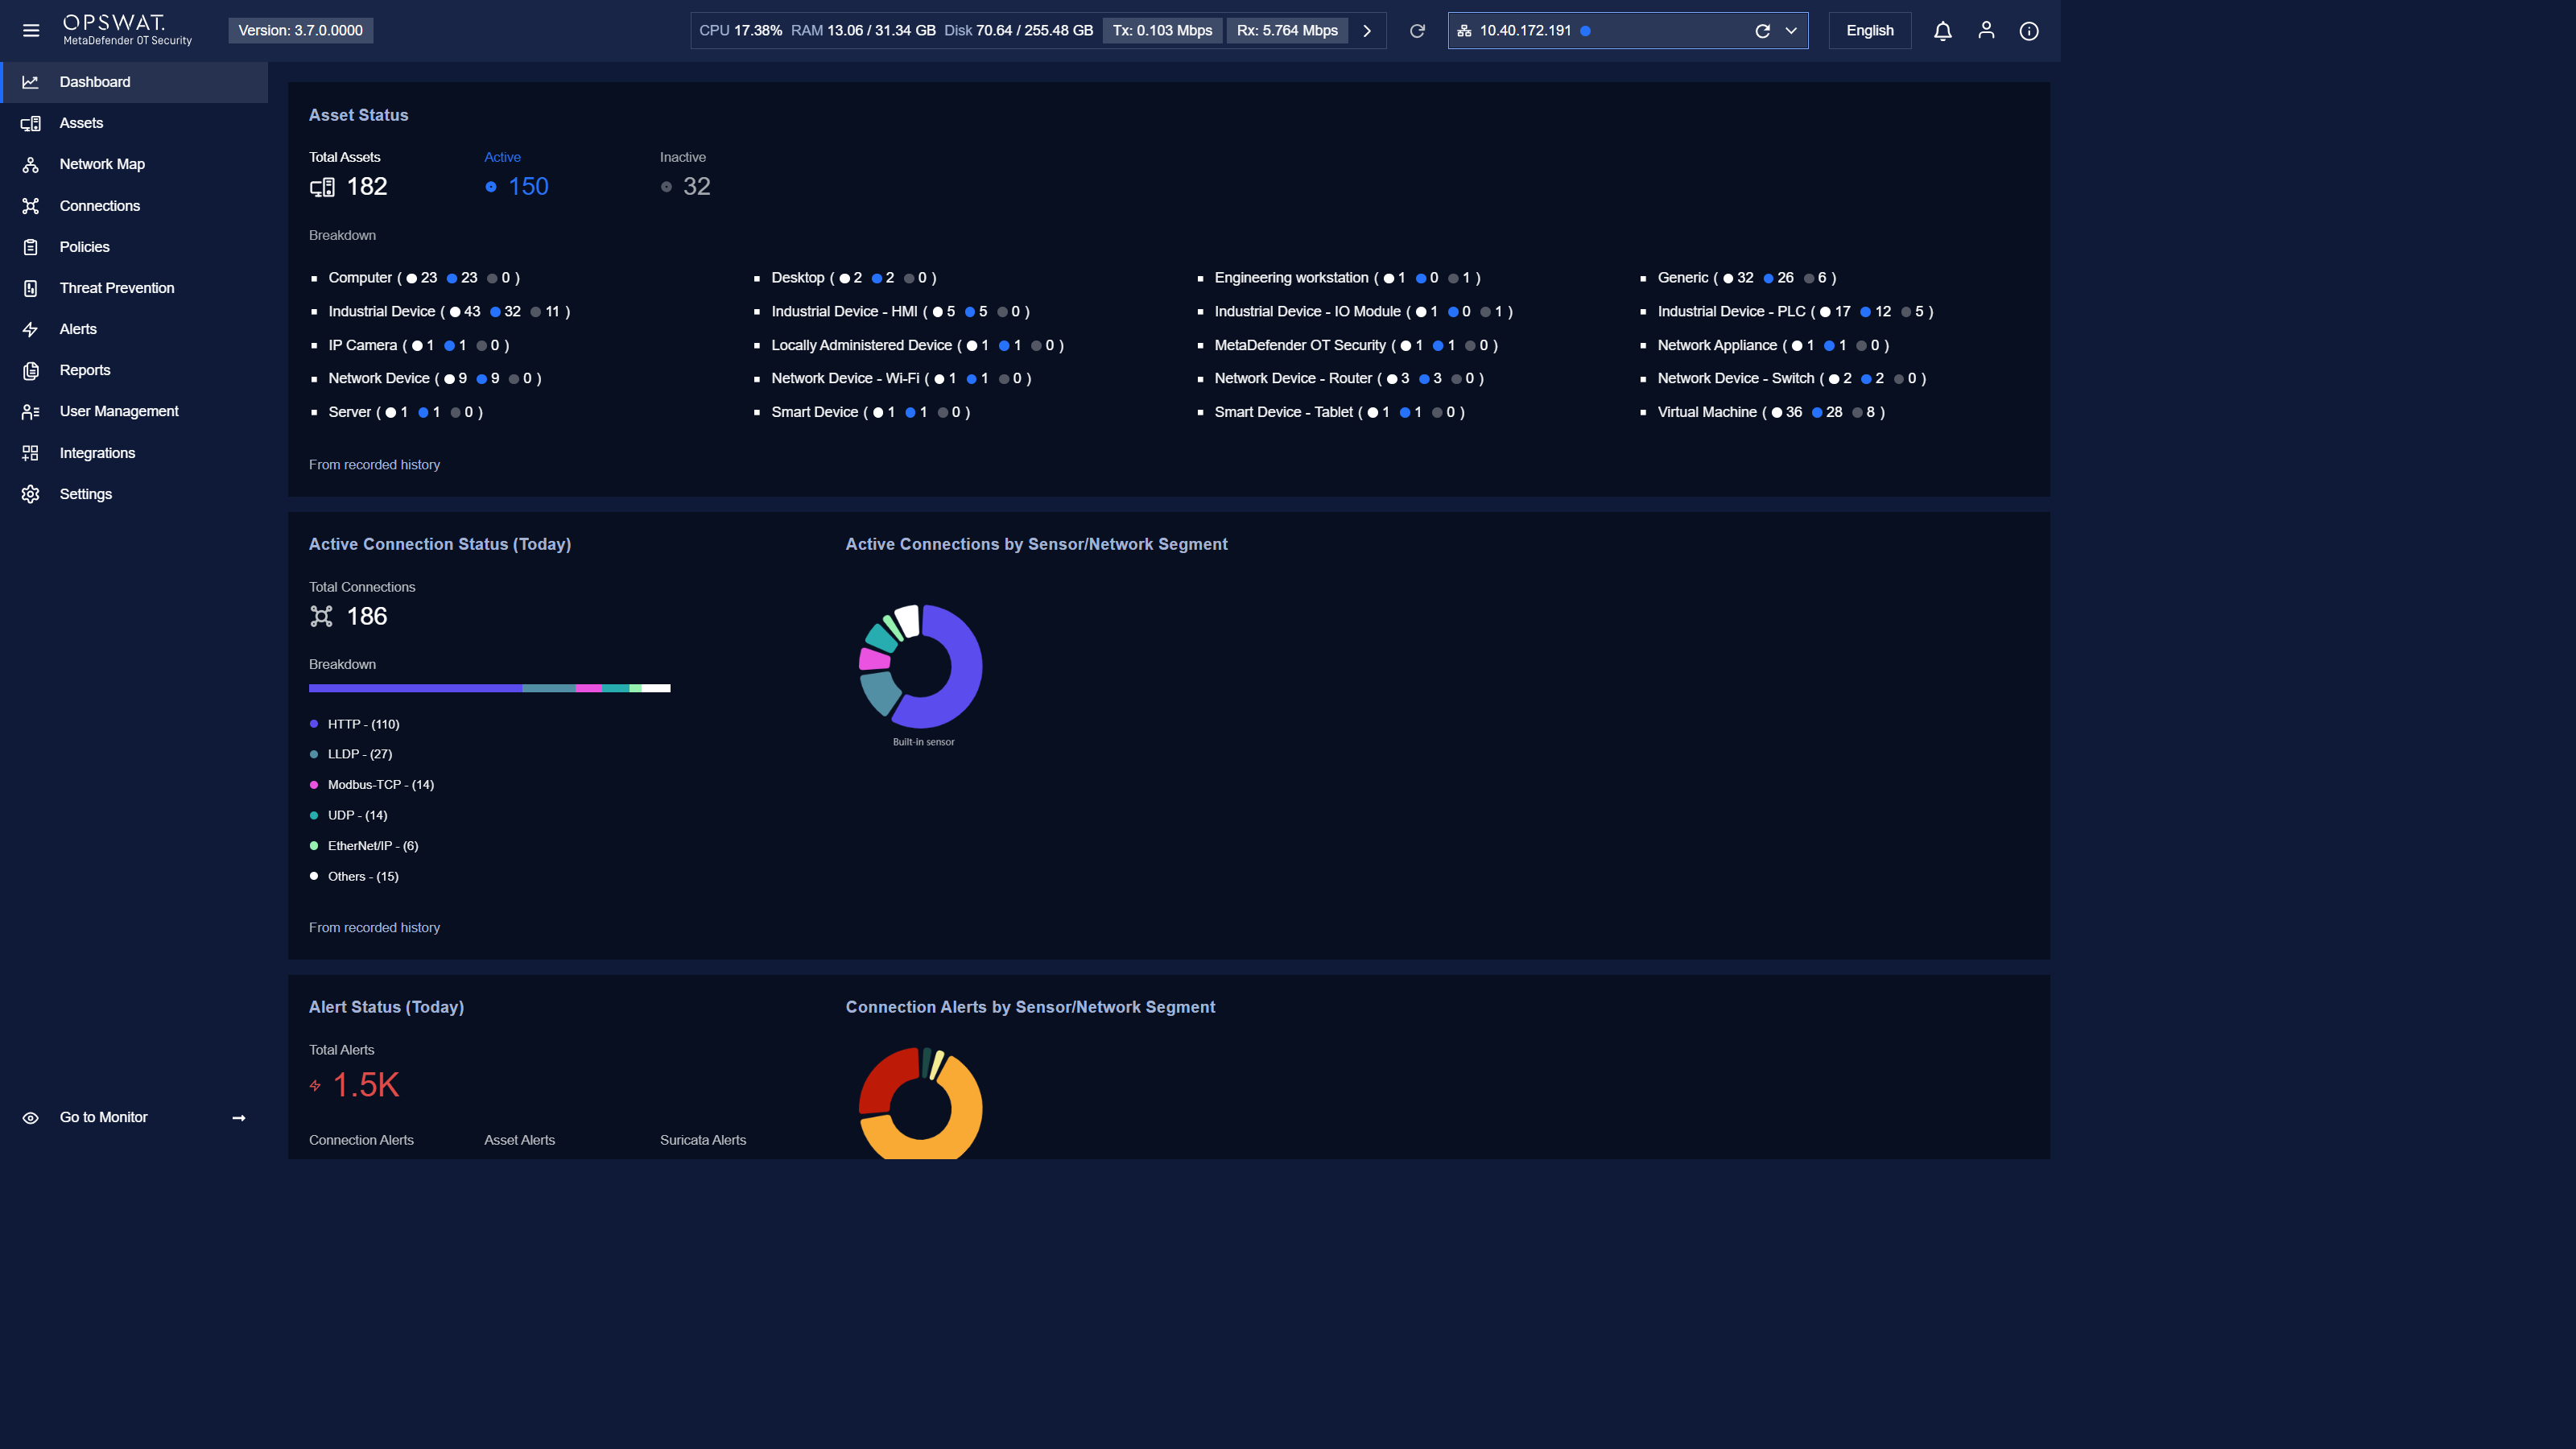
Asset Status | Shows total assets in the selected site and the active/inactive breakdown by asset type. |
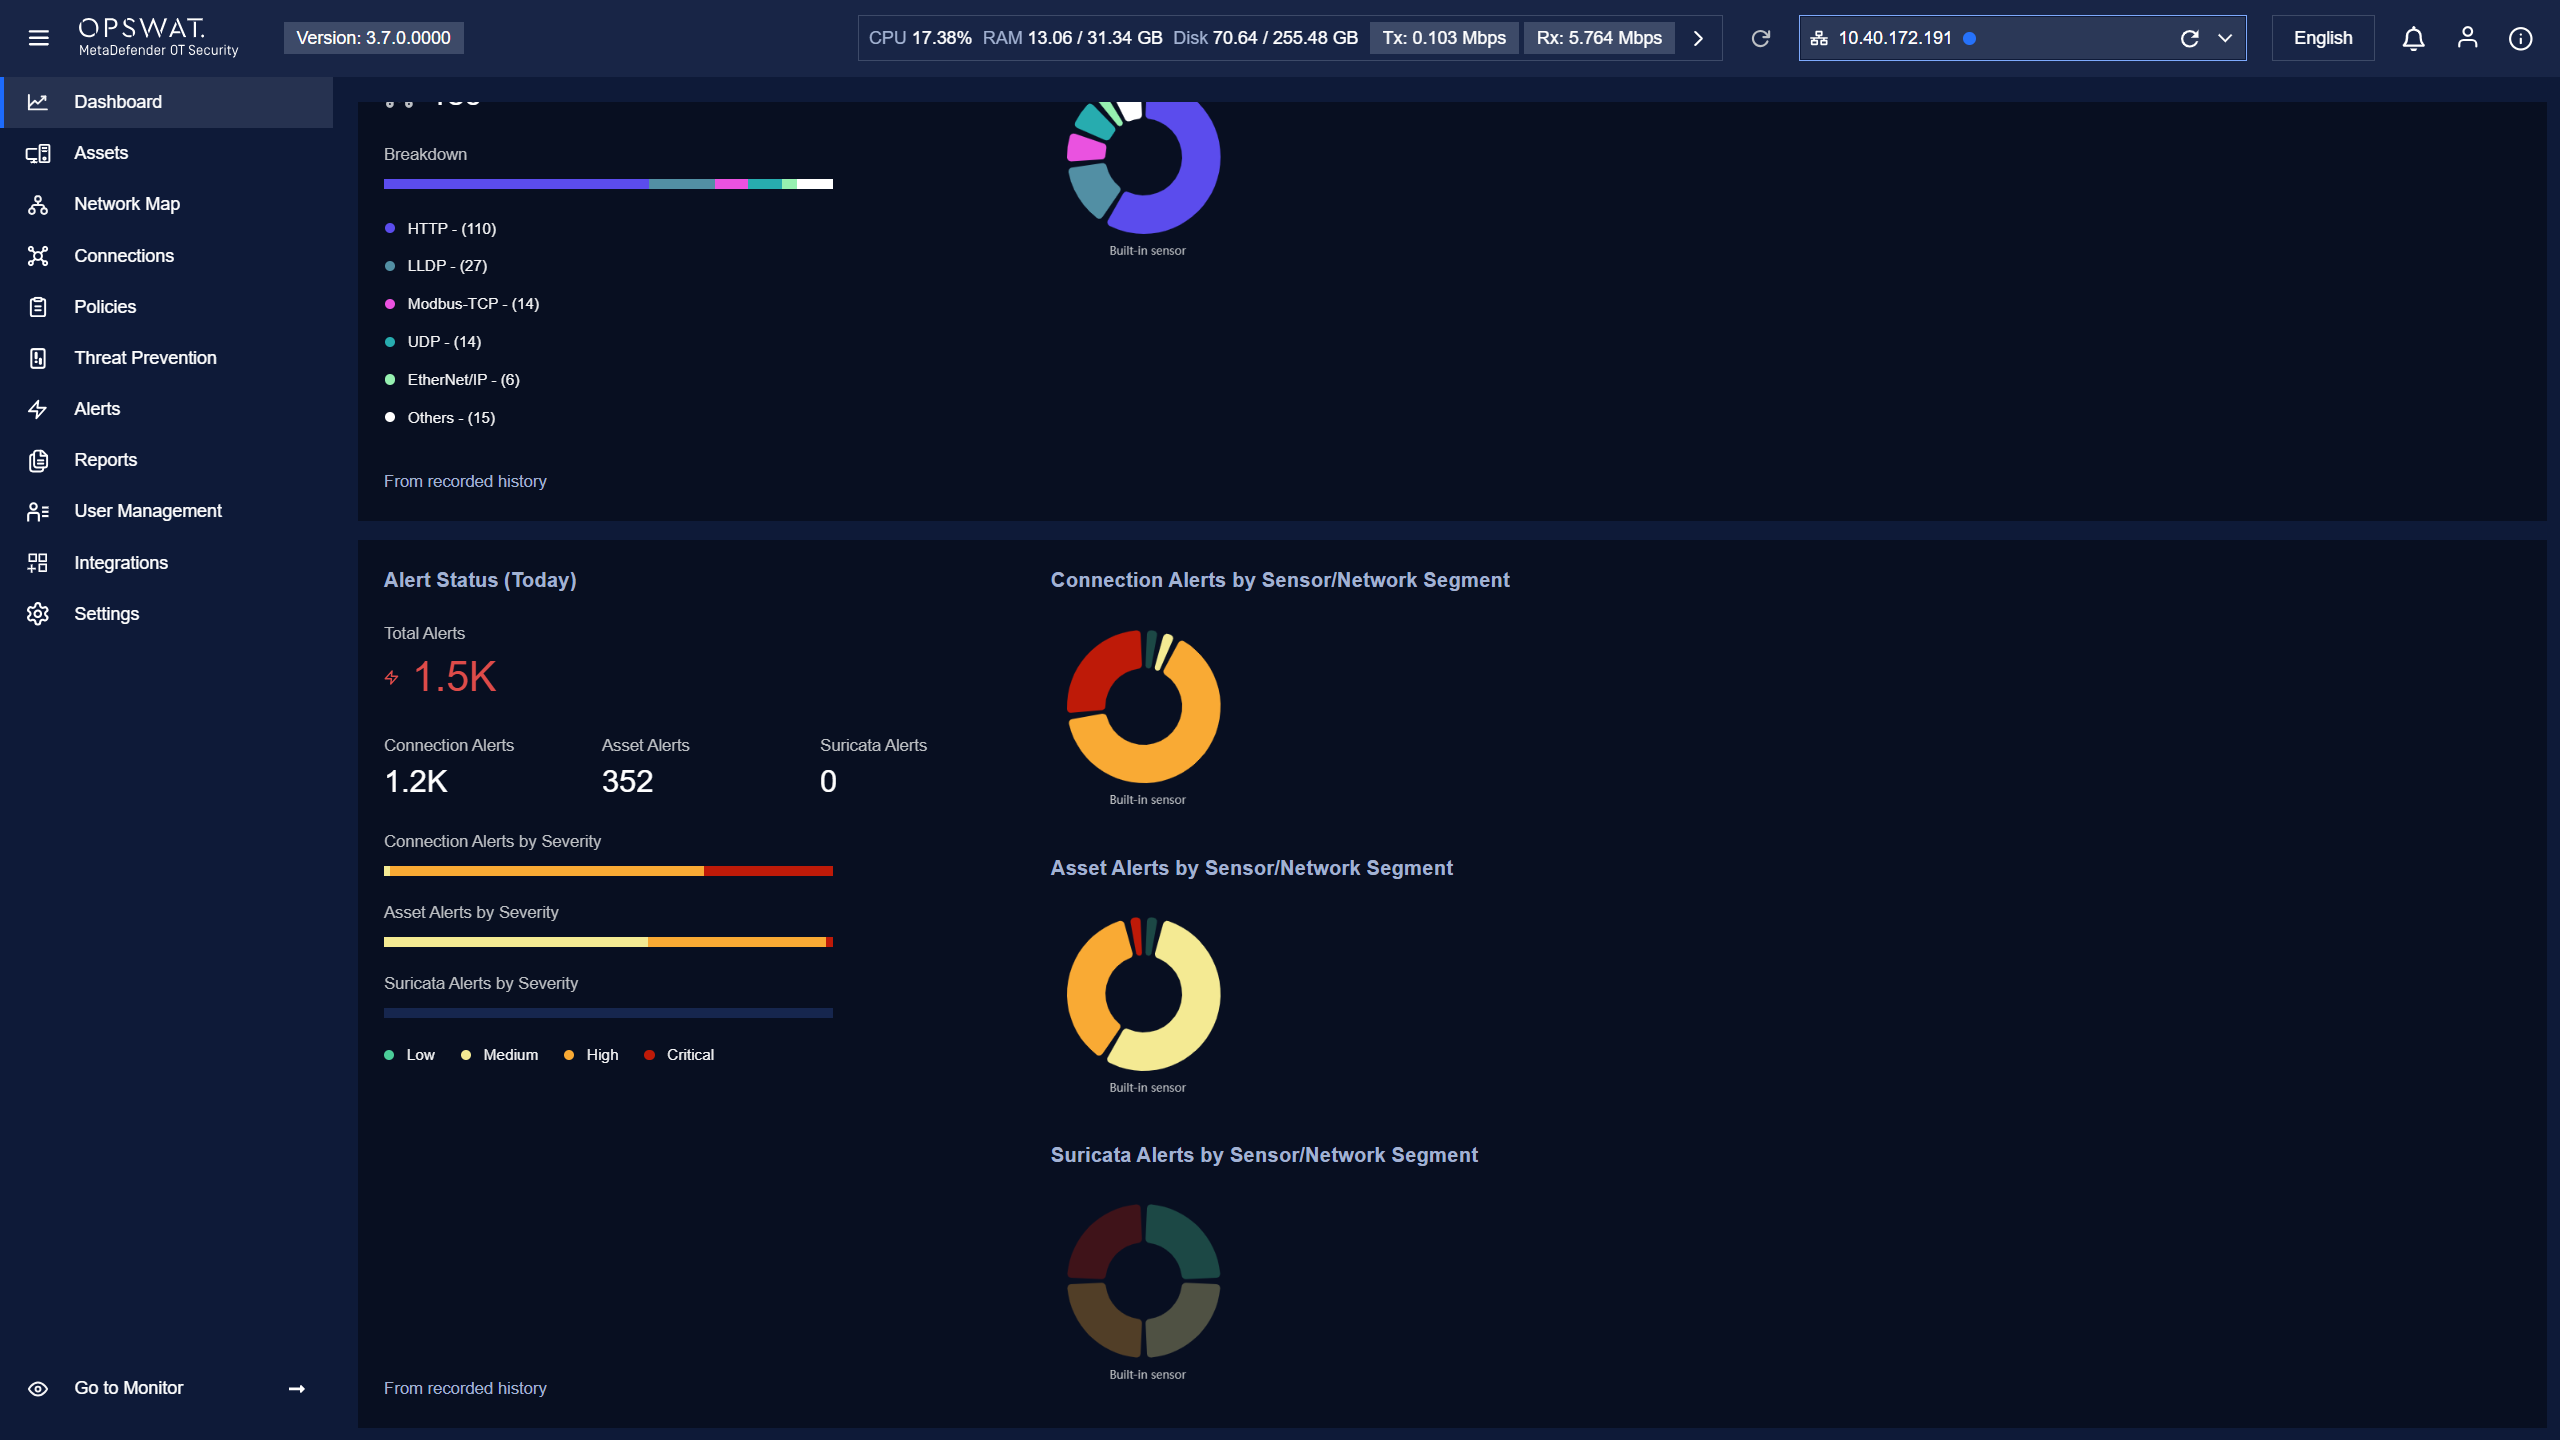
Active Connection Status (Today) | Shows current active connection count and trend for today. |
Active Connections by Sensor/Network Segment | Shows active connection distribution across sensors or segments inside the selected site. |
Alert Status (Today) | Shows total alerts and severity distribution for today in the selected site. |
Connection Alerts by Sensor/Network Segment | Shows where connection alerts are concentrated within the selected site. |
 ![
![Related navigation
Area | Purpose |
|---|---|
Assets | Inspect discovered assets and related details. |
Network Map | Review topology and physical/definition views. |
Connections | Review connection relationships and details. |
Alerts | Review and triage triggered alerts. |
Reports | Access report templates and generated reports. |
Notes
Dashboard values depend on live environment activity and retention settings.
Exact widget arrangement can vary by product version and role permissions.
Before using this page, confirm the header scope is the target site (not a sensor).