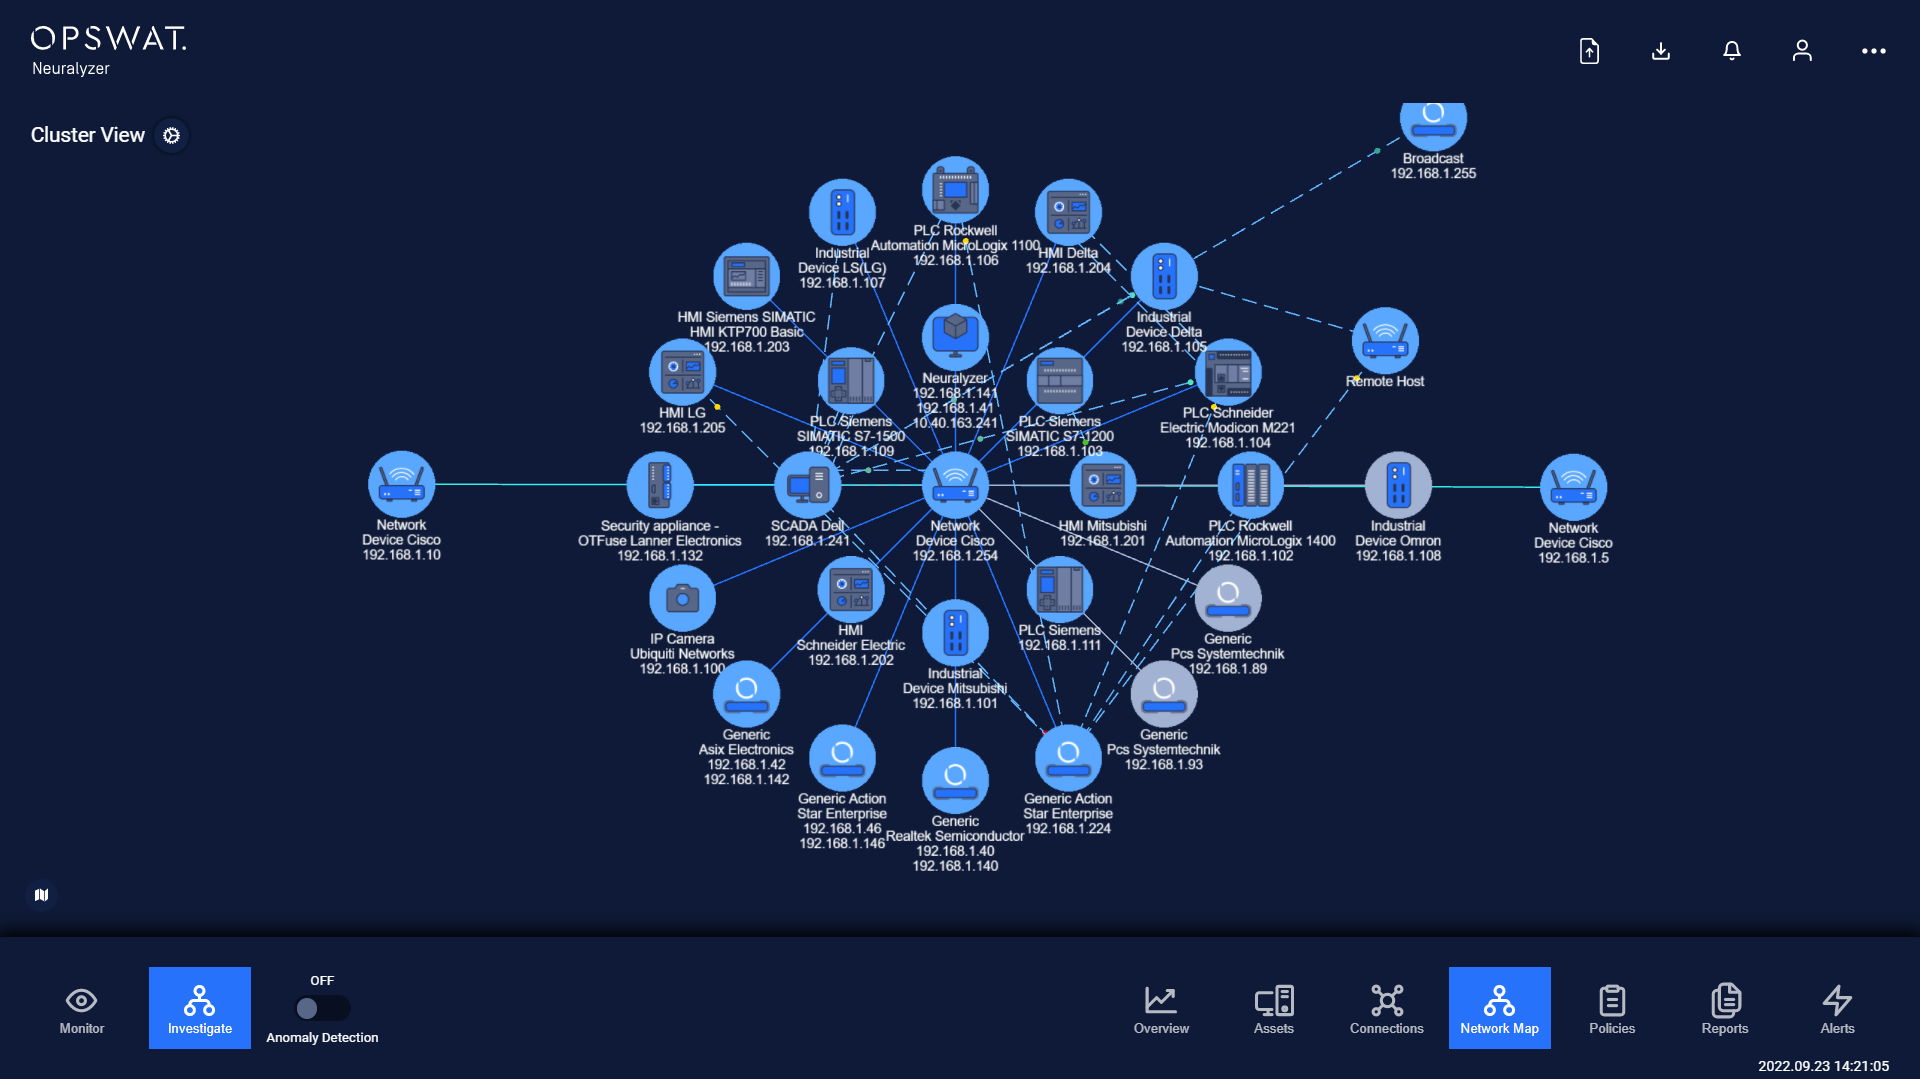
The network map visualization feature will help user to visualize the network graph in the system, the relationships between entities and easy to understand how and whether entities are connected.
This feature visible entities below:
Device nodes.
Device links.
Device connections.
Protocol flows.
Cluster boundary.
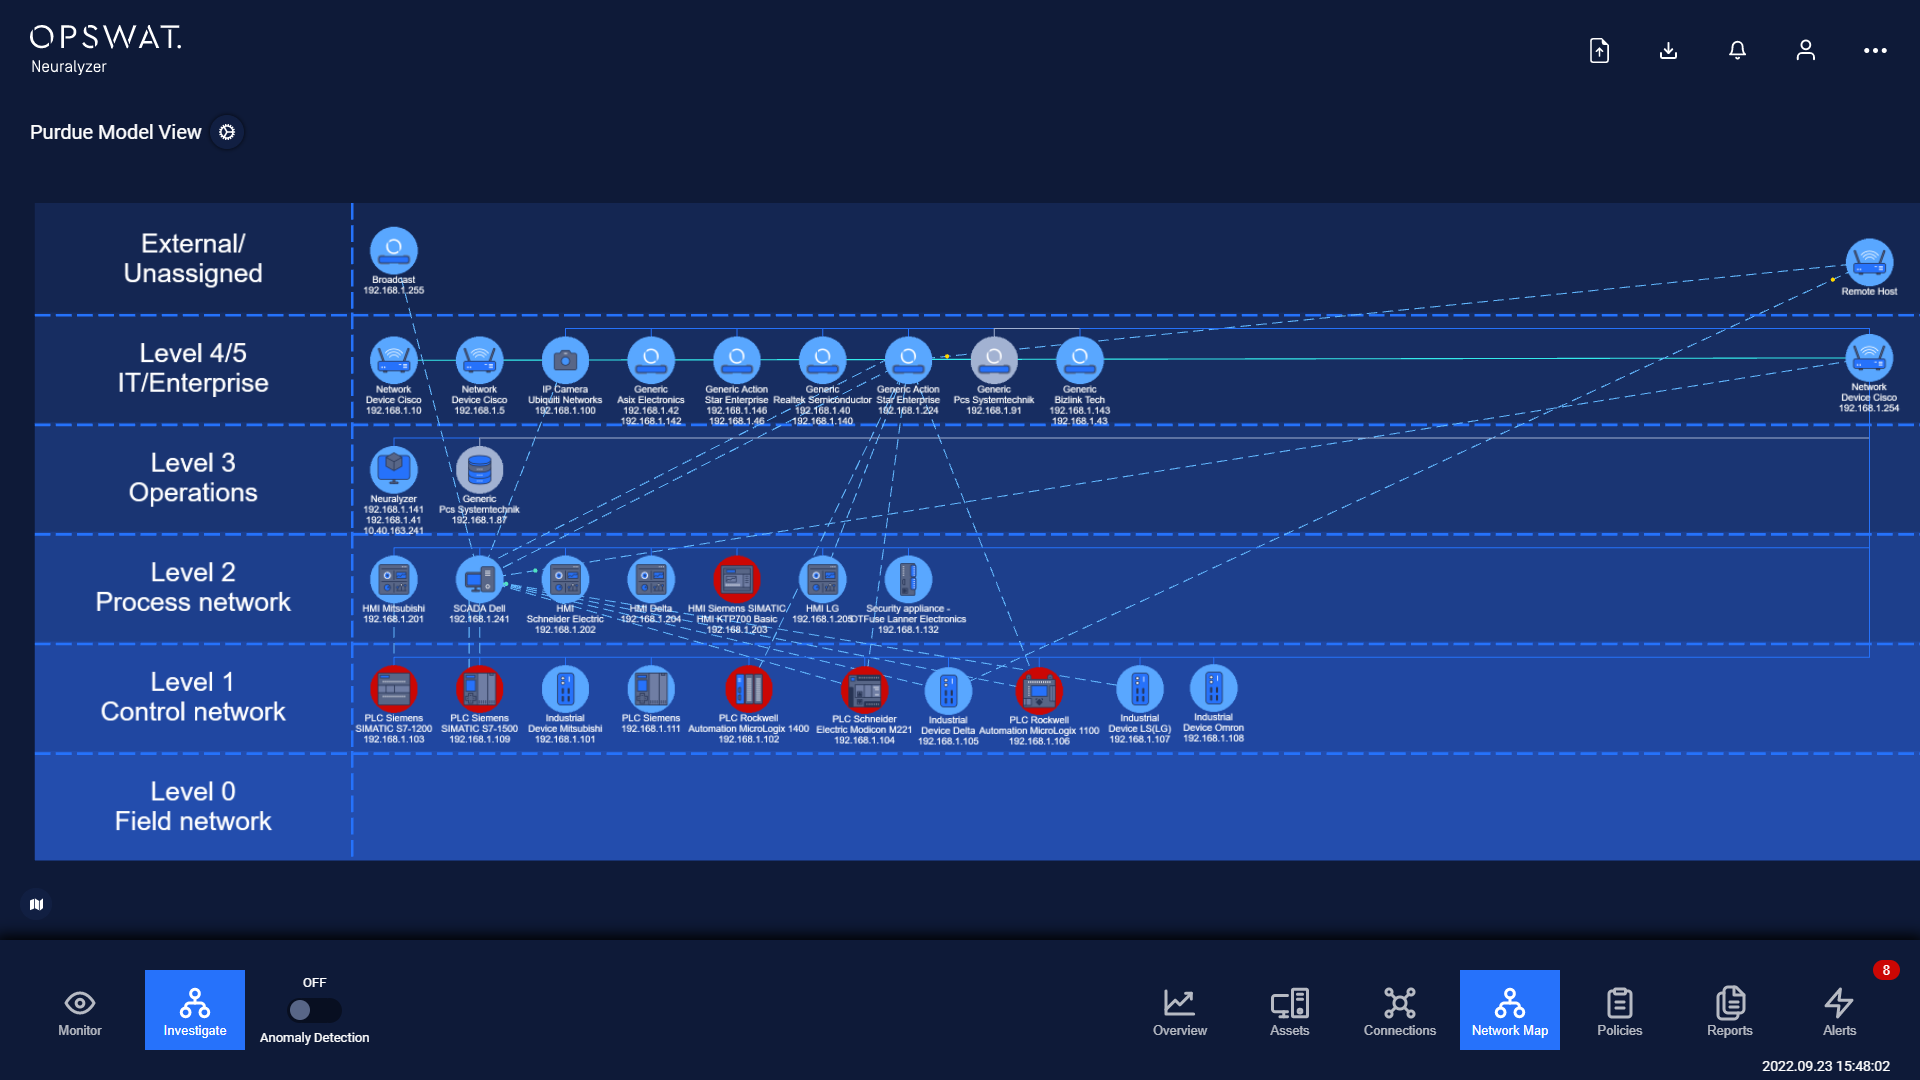
There are two type of network map: Cluster and Purdue Model.
Device node
A device node can represent either a single machine in the network, such as a HMI, PLC, SCADA or switch, server…
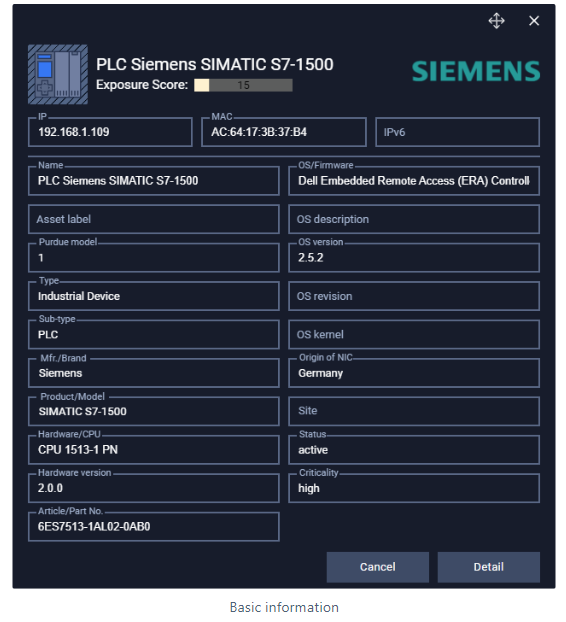
User can see device information by click/touch on the device node. There are two kind of device information: basic and detail.
The basic information
The basic device information include: device name, exposure score, IP address, MAC address, purdue model, type, sub-type, mfr./brand, product/model, hardware cpu, hardware version, article/part number, country of origin of NIC, site, status, criticality, OS/firmware, OS description, OS version, OS revision, OS kernel.
The detail information
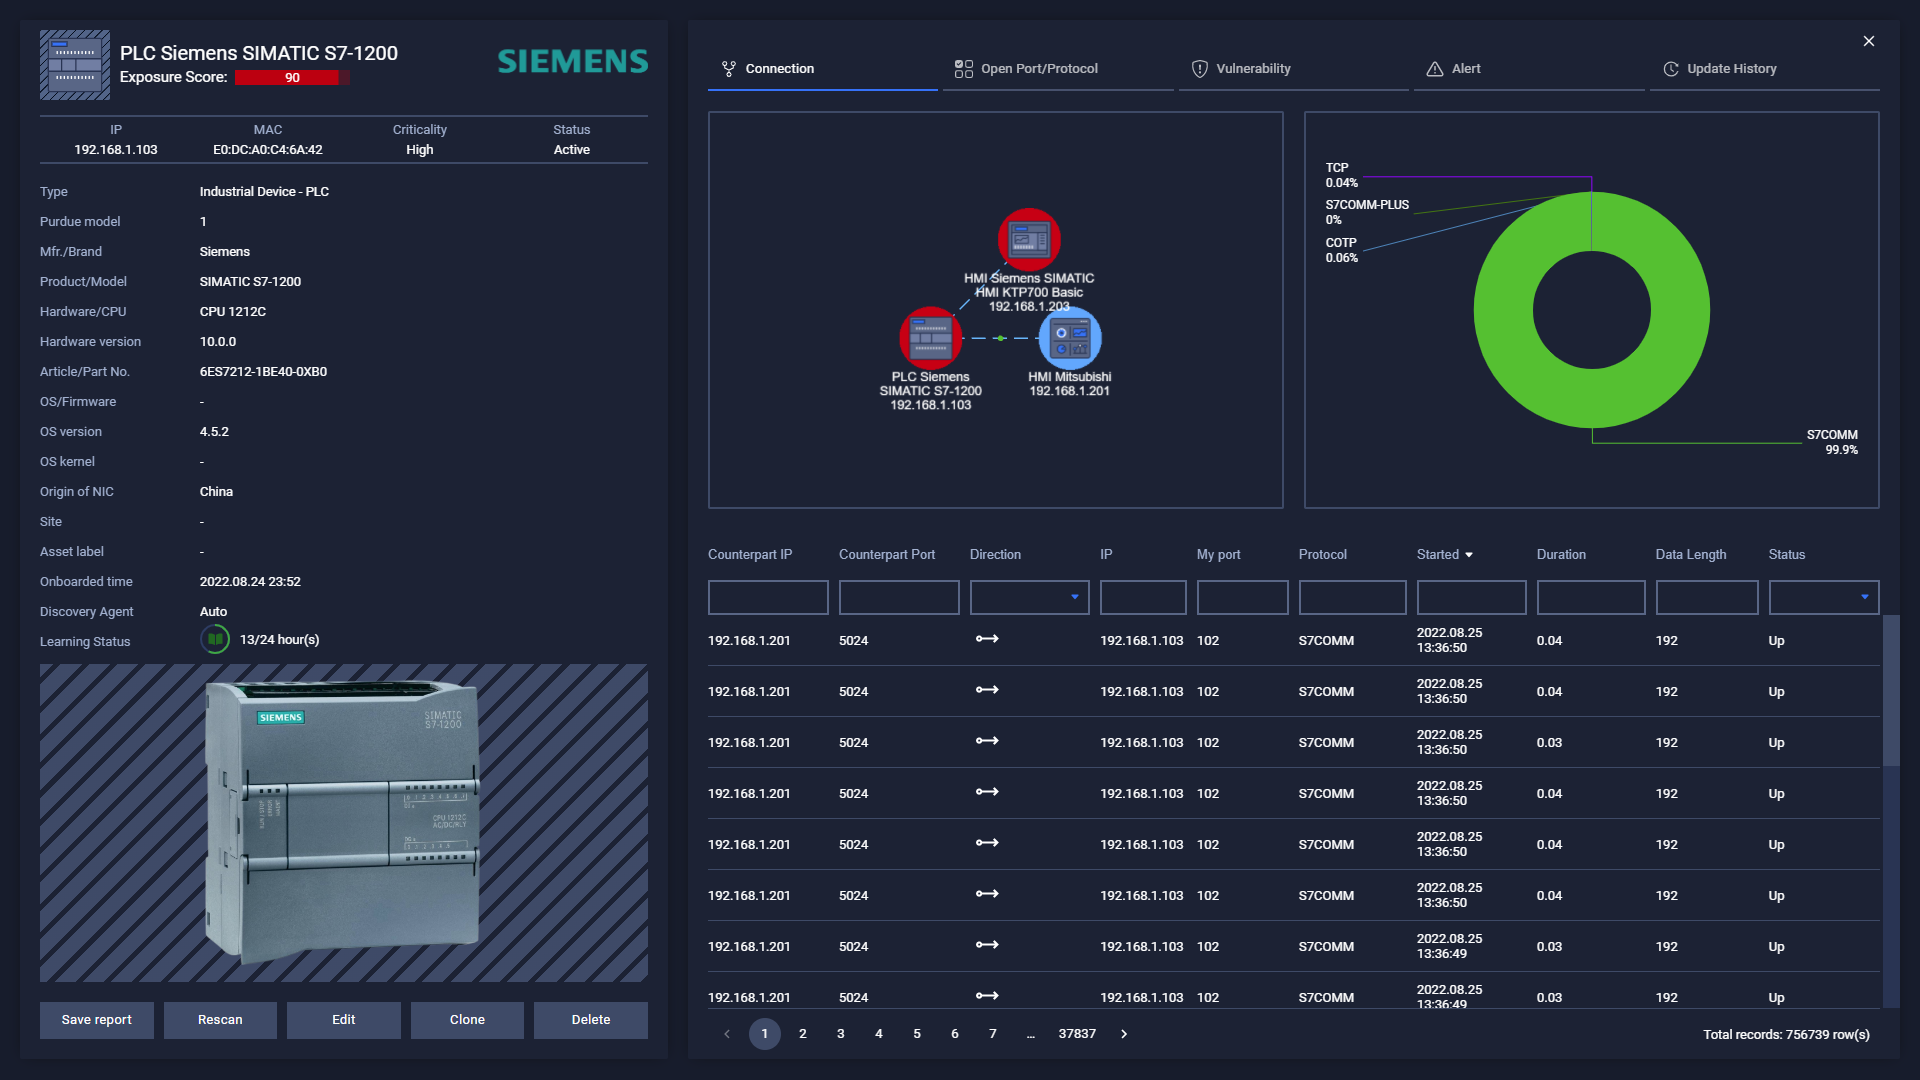
On the left side, user can see more onboarded time and discovery agent information.
On the right side there are 5 tabs contained related device information: connections, open port/protocols, vulnerability, alert and update history.
Connections
This tab will show all connection information that related to the device user is focusing.
The network connection graph will indicate what device is having connection with the current device, which protocol and the direction of protocol.
The pie chart indicate the percentage of protocol that the device is using. The chart color is also base on the protocol color.
Below is the connection list with more detail about the connections:
Counterpart IP: destination device.
Counterpart Port: destination port.
Direction: the direction of protocol between source and destination device.
IP: source device (focused device).
My port: port of focused device.
Protocol: all protocols that used to communicate on this device.
Started: time of the connection is established.
Duration: communication time of connection.
Data length: packet length.
Status: status of connection (up/down).
Open Port/Protocols
This tab indicate the current open port and protocols on the device. (Refer to Device Manipulation for more detail.)
Vulnerability
This tab indicate the Unpatched CVE that the device is being violated. (Refer to Device Manipulation for more detail.)
Alert
This tab is used to check if this device used to be alerted. The alert information is same with alert list page. (Refer to Device Manipulation for more detail.)
Update history
This tab will track the device property changing. User can follow from old to new value. (Refer to Device Manipulation for more detail.)
Device link
A device link (straight line) represent for the physical link between two devices. The device link is created base on the IP range of network device that the device is connecting to. That mean, user must define the subnet mask for network device so that Neuralyzer can create the physical link automatically.
If the device is become inactive, the physical link will be gray.
User can show/hide physical link by check/uncheck Show physical links on tooltips button.
Device connections
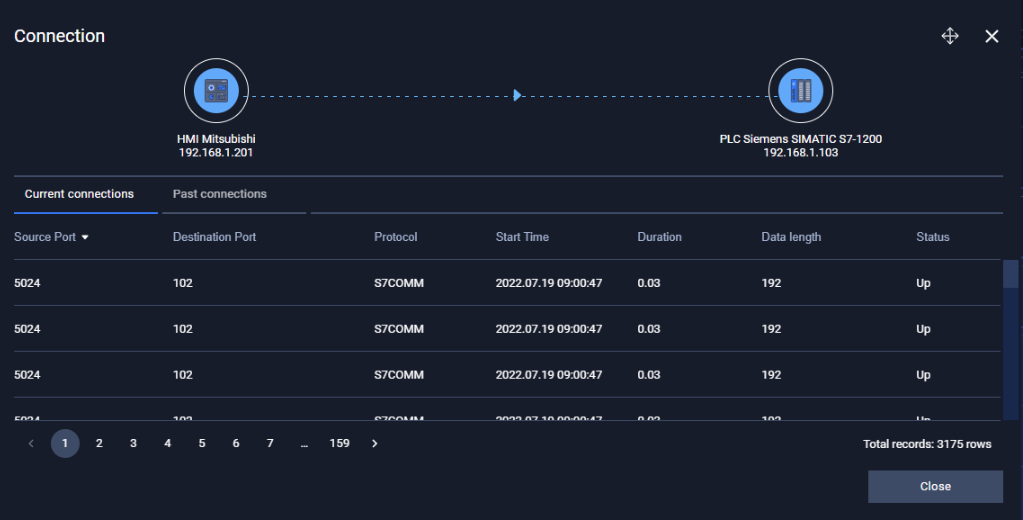
A device connection (dash line) represent for the connection between two devices. One device can have one or more connection to one device. User can click/touch on the connection to see more detail.
The header graph indicate the connection direction.
On Current connections tab, user can see the active connection with status is “Up”. If the all connections is down, it will be moved to the past connection. In this time on the network map, the connection link is blurred and it is unclickable. After 5 mins, if there is no connection on the device anymore, the connection link will be removed on graph.
On Past connections tab, user can see the inactive connection with status is “Down”.
If the device is become inactive, the connection will also be gray.
User can show/hide connections by check/uncheck “Show connections” on tooltips button.
Protocol
A protocol is a particle moving on the connection between 2 devices.
One device can have multiple connections to another device. In this case, on graph just only show one connection but many particles which represent multiple protocols/services.
User can have a quick overview what protocols are on the connection by hover on that connection.
The particle direction is indicate the direction where the device is communicating to.
The protocol color can be set at protocol setting.
User can show/hide protocol direction by check/uncheck Show protocol flow on tooltips button.
Cluster
A cluster is a group of devices. A cluster is defined base on the IP range of the network device.
User can show/hide cluster by check/uncheck “Show cluster’s boundary” on tooltips button.