
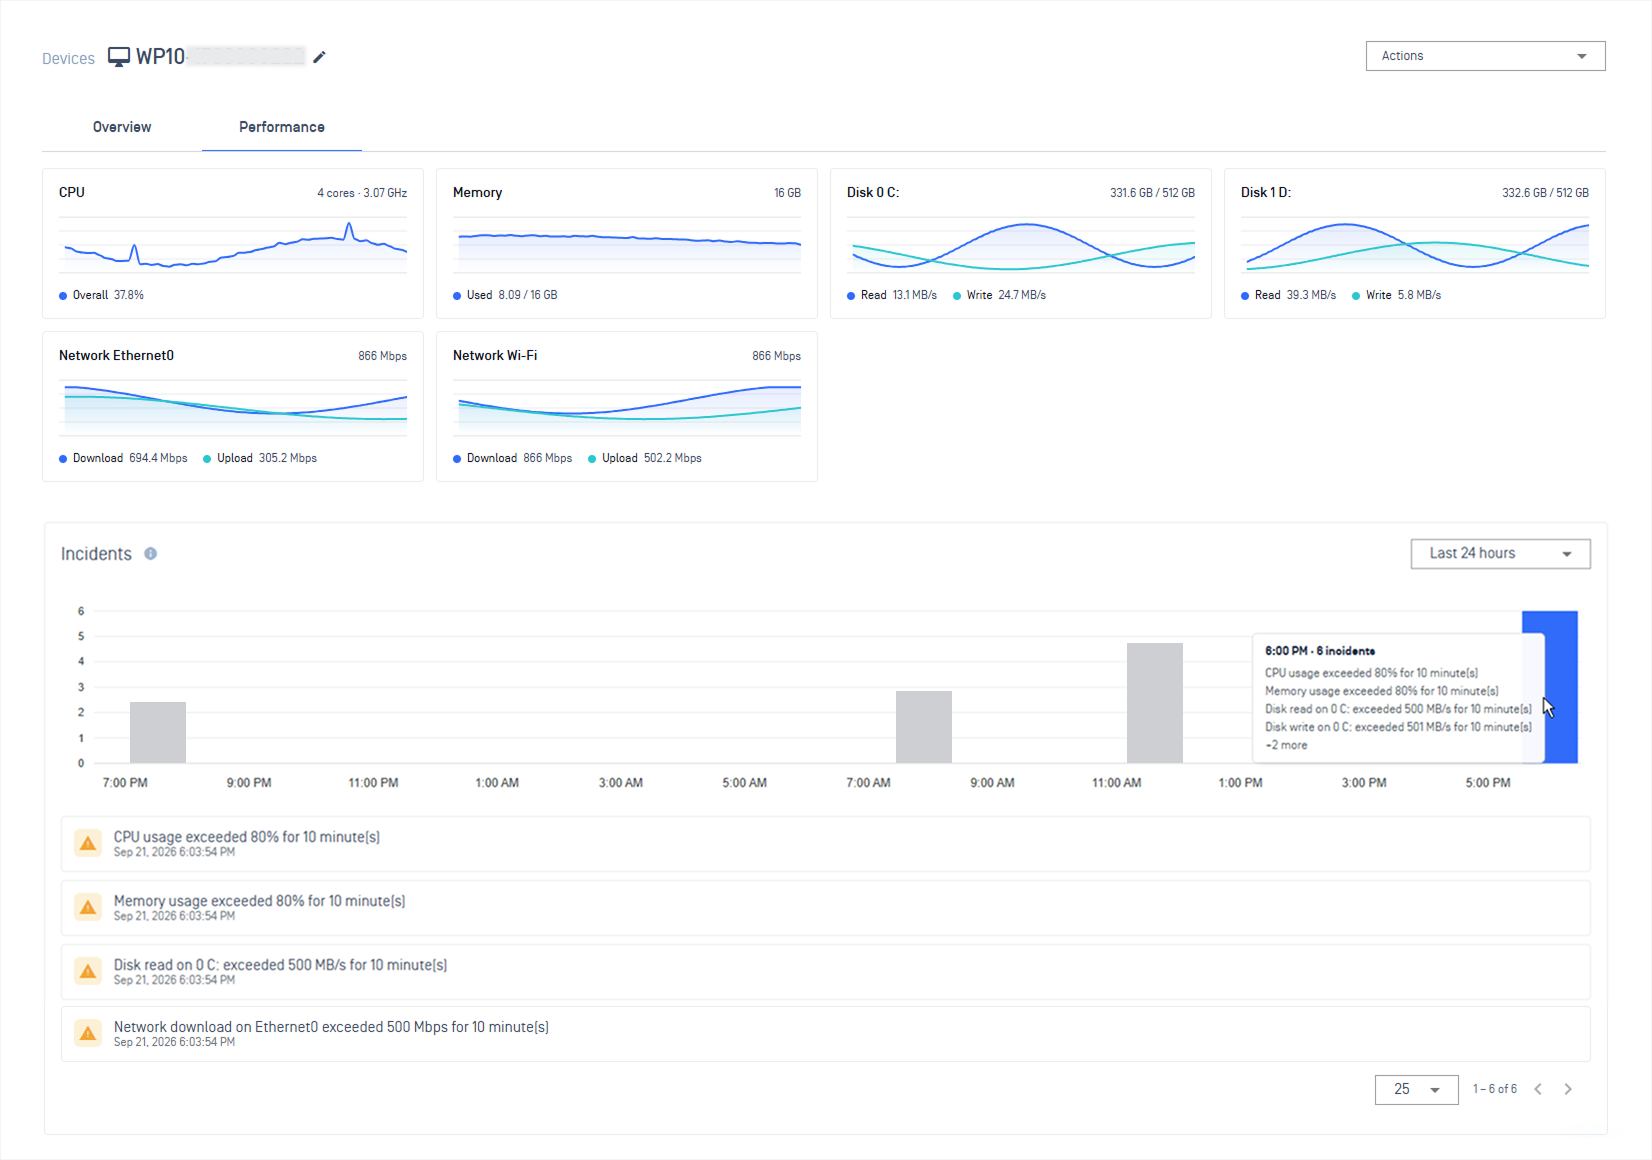
Endpoint Performance Monitoring gives administrators real-time visibility into the health and workload of managed Windows endpoints. It provides:
Performance monitoring: Live charts displaying real-time CPU, Memory, Disk activity, and Network traffic while the administrator has the device page open. See How to View Endpoint Performance.
Incidents history: Automatically generate incident logs and alerts when usage stays above safe limits for too long. See How to Set Up Alert Thresholds.
Supported Platforms & Requirements
Requirement | Details |
|---|---|
Supported OS | Windows (macOS and Linux are currently not supported) |
Console Version | Cloud or On-Premises (Release 10.7.26092 or later) |
Persistent Agent | Version 7.6.2609.1108 or later |
On-Demand Agent | Version 7.3.2609.530 or later |
How to View Endpoint Performance
In the left navigation bar, go to Inventory > Devices
Select a Endpoint Windows device
Click the Performance tab from the top menu bar.
Endpoint Performance
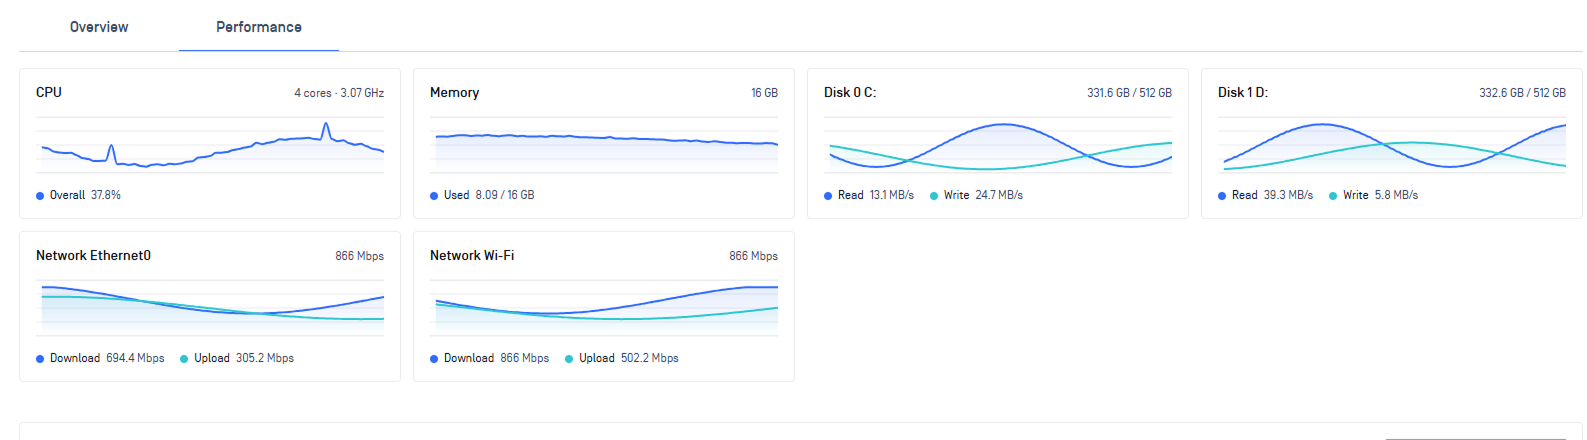
Shows live usage data for CPU, Memory, Disk Read/Write, and Network
Data updates automatically every 30 seconds
When you open the tab, the agent begins streaming telemetry. Polling automatically stops a few minutes after you leave the tab to save bandwidth
Incidents History
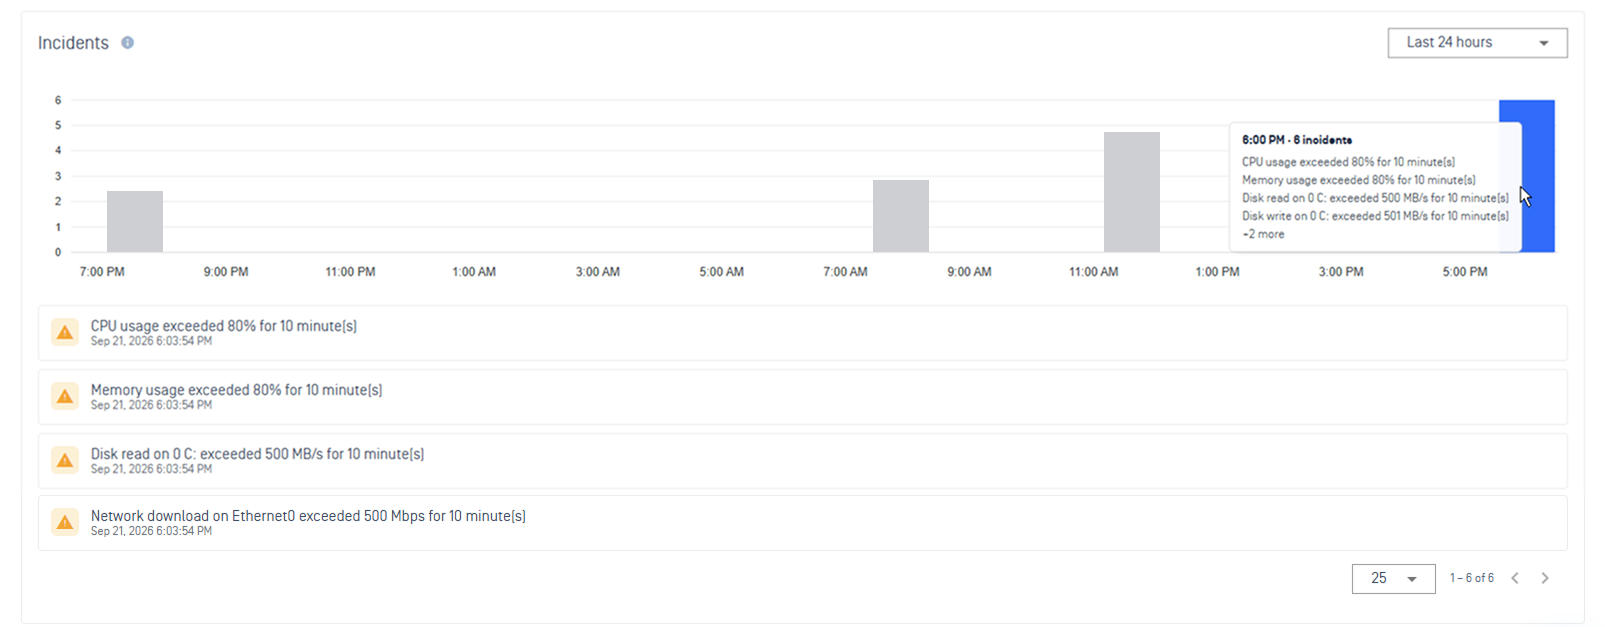
Displays total incident trends grouped across your selected timeframe (1 hour, 24 hours, or 7 days).
Lists every sustained threshold breach recorded over the past 7 days
Incident records are automatically stored for 7 days.
How to Set Up Alert Thresholds
An incident is created only when a metric exceeds its threshold continuously for the full duration specified. This prevents false alarms from short, temporary spikes.
Set Global Rules (Applies to all devices)
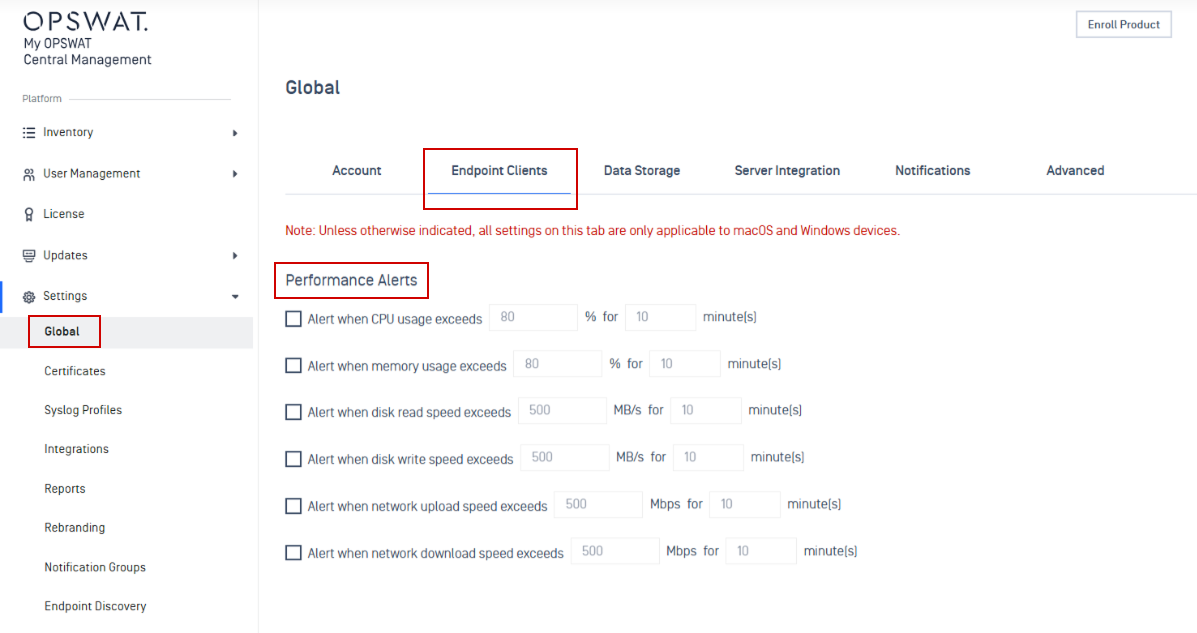
Go to Settings > Global > Endpoint Clients
Scroll down to the Performance Alerts section
Select any rule you want to activate
Enter your desired Threshold and Duration (in minutes)
Click Save
Set Group-Specific Rules
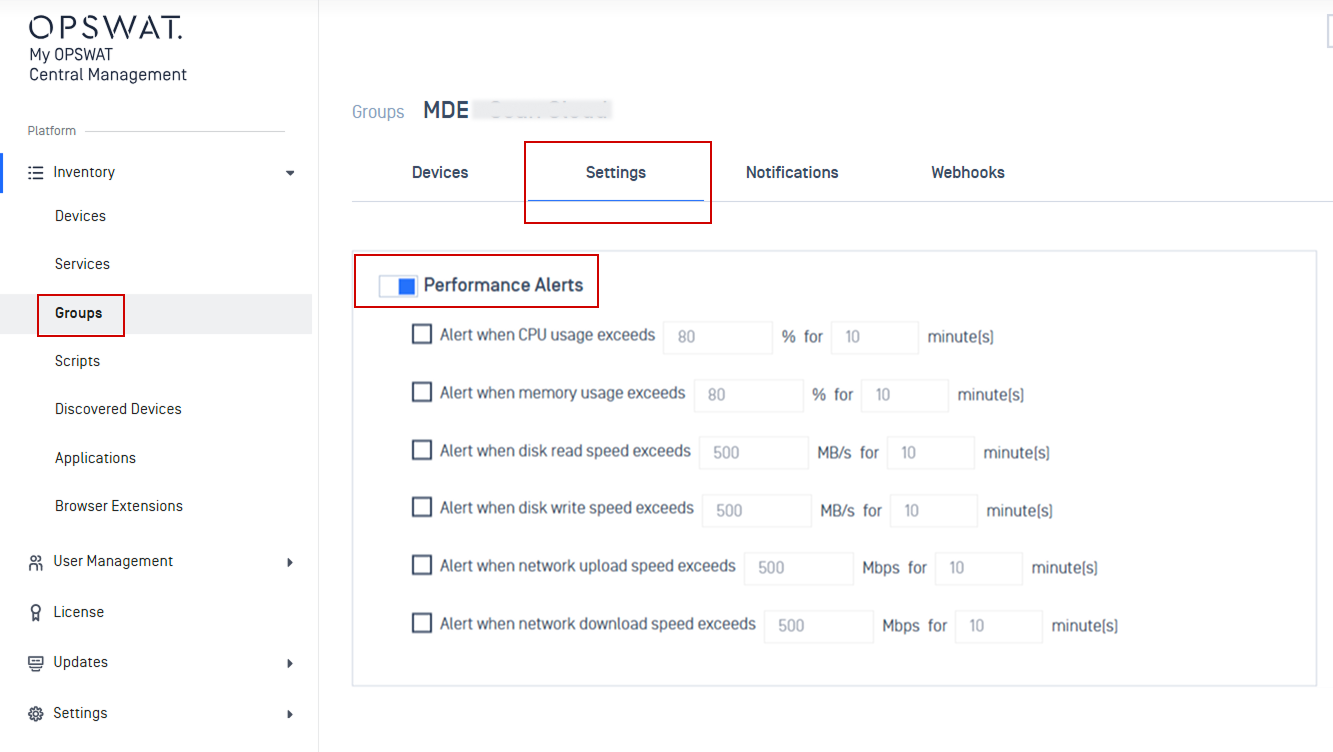
Go to Inventory > Groups and select your target endpoint group
Open Settings tab
Under Performance Alerts, configure the threshold and duration values for this group
Click Save