The System Dashboard provides an overview of system activity, user distribution, user login failures, license information, and storage usage.
The time interval selector allows you to adjust the reporting period for most of the widgets, except License Status, Number of Users, Database Storage Monitoring and the File Storage Status widgets (these show the actual information).
Data for the Upload and Download Volumes and Upload and Download Quantity widgets is collected only from version MetaDefender® MFT 3.9.2, for the Top 5 File Types and Extensions widgets from version 3.11.1 onward. If your system was upgraded from an earlier version, no historical data prior to the upgrade will be available in these widgets.
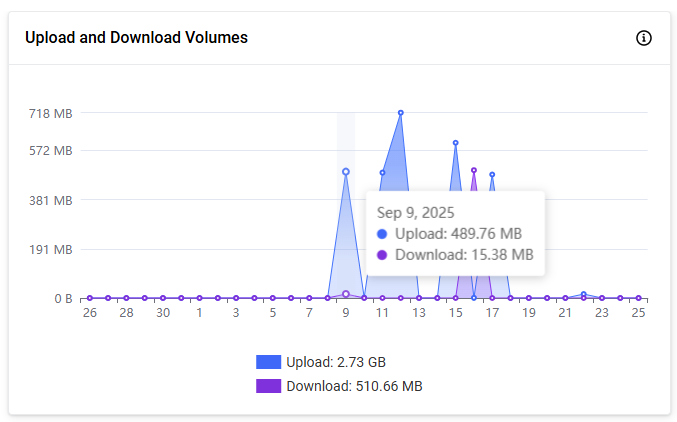
Upload and Download Volumes
This widget shows the total volume of data uploaded and downloaded during the selected time range. This helps administrators monitor throughput and identify activity peaks.
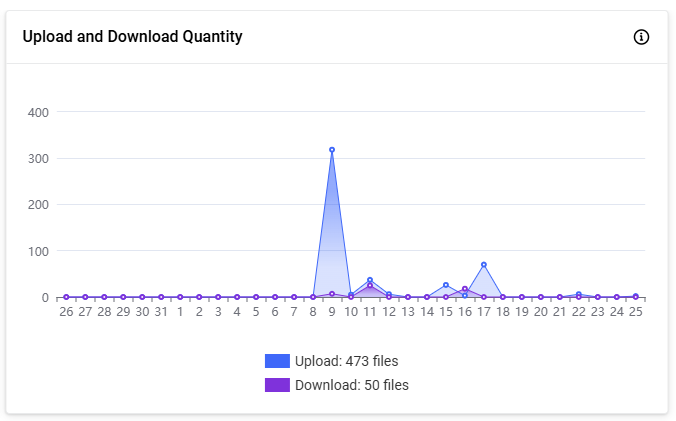
Upload and Download Quantity
Displays how many files were uploaded and downloaded within the selected time range, allowing admins to observe usage trends.
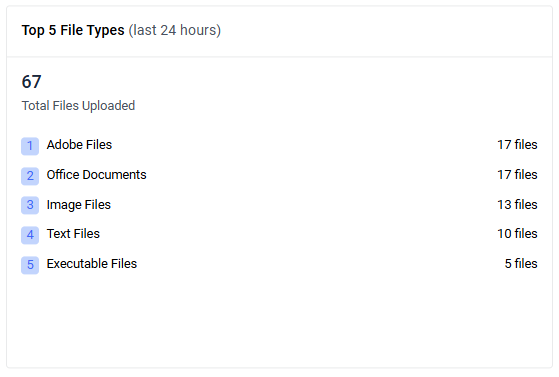
Top 5 File Types
Shows the top five file type categories by upload quantity within the selected period, along with the overall total. Use this widget to quickly identify predominant file types.
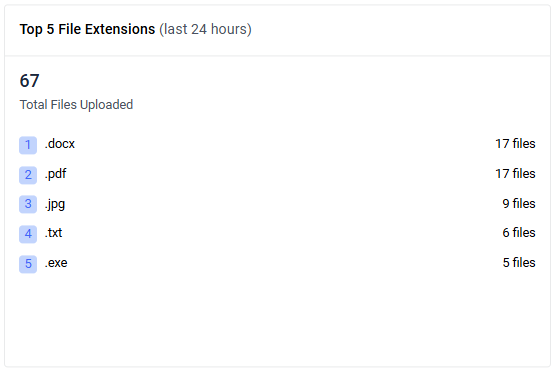
Top 5 File Extensions
Displays the five most-uploaded file extensions for the selected time range. The header shows the total files uploaded; each row lists the extension and its count.
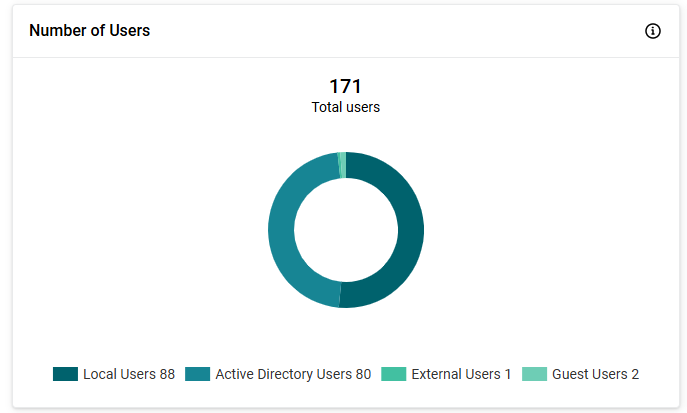
Number of Users
This widget displays the total user count in your system. It also provides a breakdown of user types (local users, Active Directory users, external users and guest users) using a doughnut chart for easy visualization.
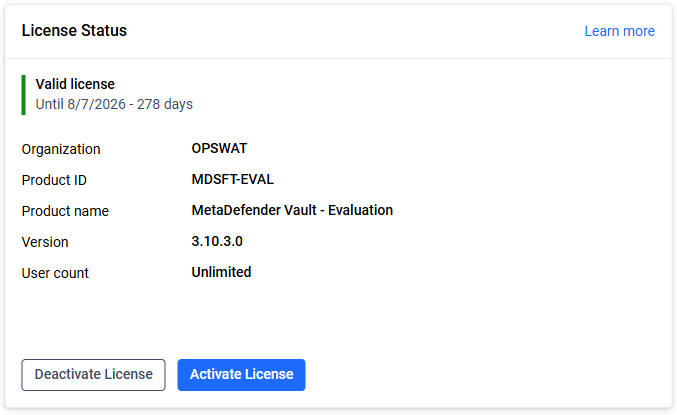
License Status
This widget provides a snapshot of your current license information directly on the dashboard. It displays the essential license details, including user count and expiration date, and allows you to perform key licensing actions such as activation or deactivation. For comprehensive information about license management and actions, please refer to the License configuration page.
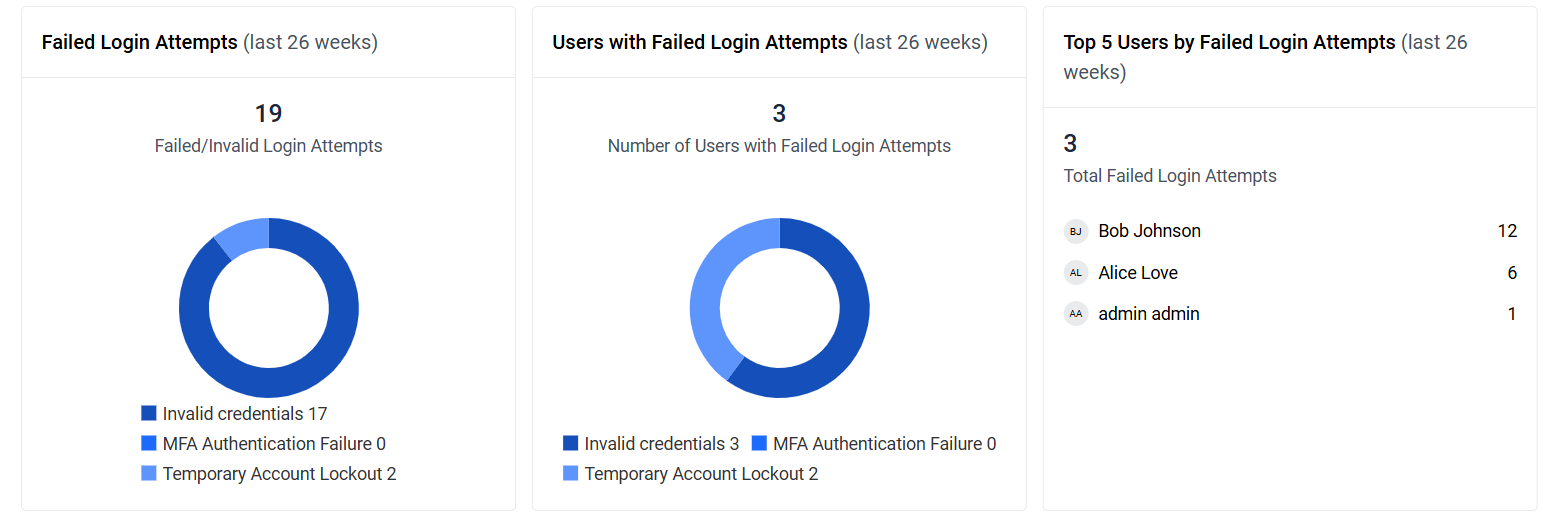
Failed Login Attempts
This widget shows the total number of failed login attempts within the selected time range. It also breaks down failures by category in a doughnut chart: invalid credentials, MFA authentication failure, and temporary account lockout.
Number of Users with Failed Login Attempts
Displays the number of unique users who had at least one failed login attempt during the selected time range. The doughnut chart groups affected users by failure category: invalid credentials, MFA authentication failure, and temporary account lockout.
Top 5 Users by Failed Login Attempts
Shows the top five users with the highest number of failed login attempts for the selected time range, along with the total count. Each entry lists the username and the number of failed login attempts.
Database Storage Monitoring
This widget summarizes the current status of database storage usage. For more detailed information, refer to the Database Storage Monitoring page.
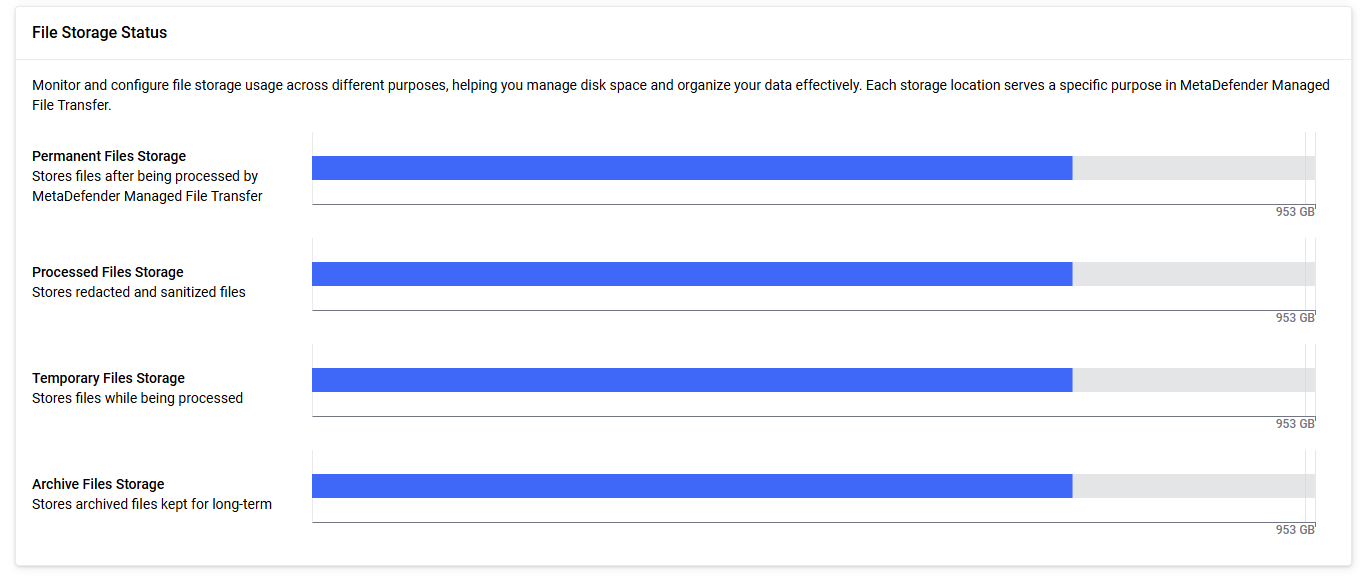
File Storage Status
This widget provides a bar chart showing the used and free space across all file four (permanent, processed, temporary, archived) storages. It helps administrators quickly assess storage availability and usage distribution.