Overview
When you open the MetaDefender Industrial Firewall MetaDefender Industrial Firewall web interface, the Dashboard is the first page shown. It gives a real-time overview of the appliance's status and performance
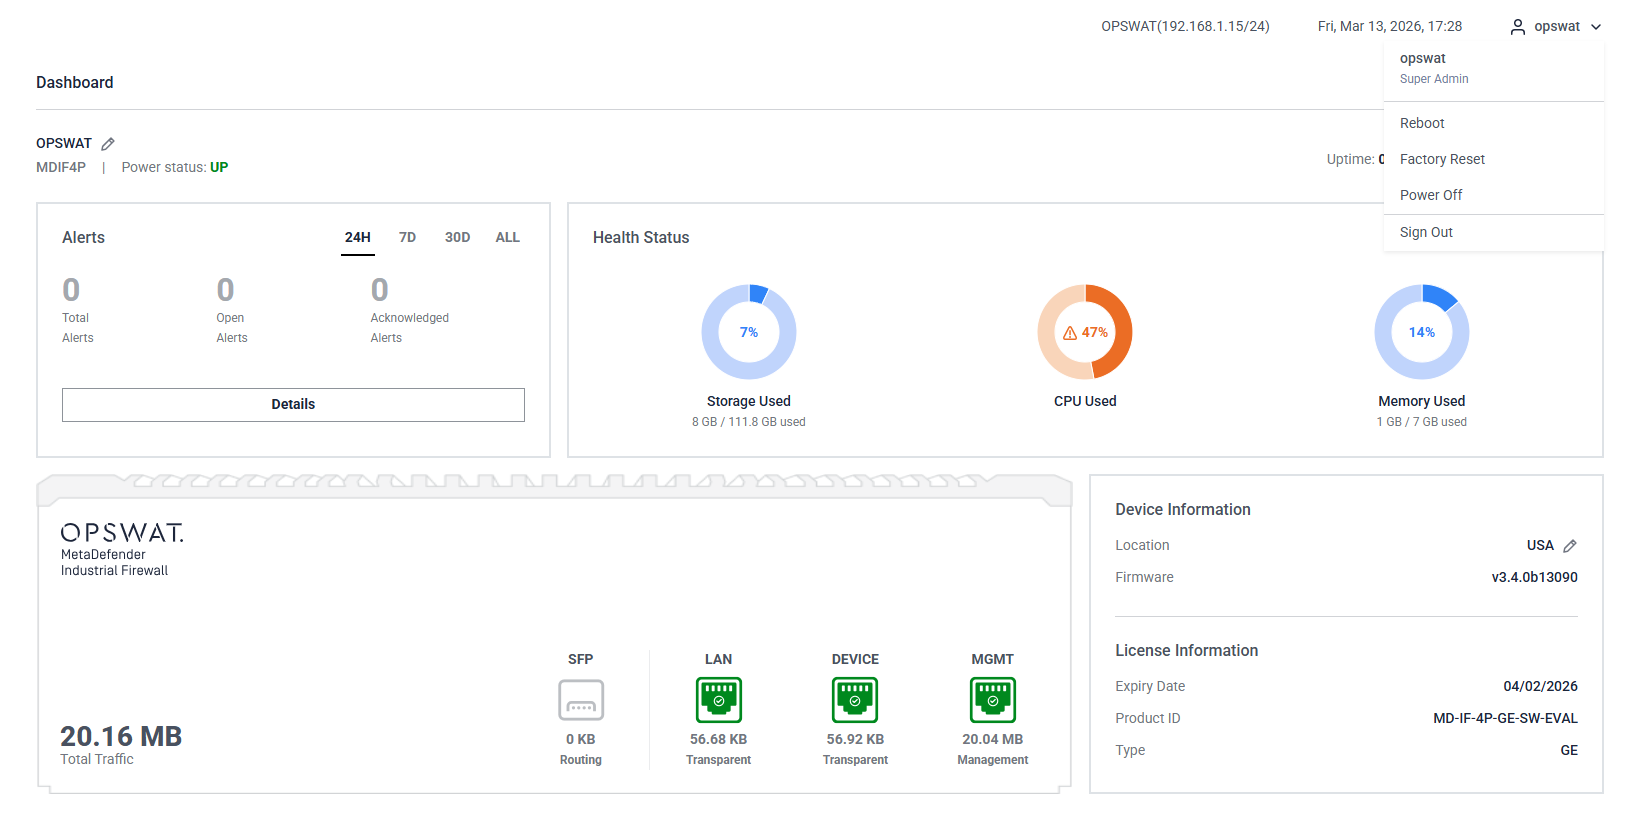
The Dashboard is made up of separate widgets, each showing one area of the appliance's status:
Alerts: Recent blocked-traffic events for your Protected OT Assets (defined in the firewall's Learning Mode settings). Use the range selector (24H, 7D, 30D, ALL) to change the period, and Details to open the full Alerts page.
Health Status: Provides usage information for storage, CPU, and memory. The status is color-coded:
Blue: Usage is below 45%.
Orange: Usage is between 45% and 90%.
Red: Usage exceeds 90%.
Total traffic: Tracks and displays all incoming and outgoing traffic through the appliance, including the status and mode of each physical port (SFP, LAN, DEVICE, MGMT).
Device Information: Shows the device's location and firmware version. The location is editable.
License Information: Displays the license's expiration date, product ID, and type (GE or Standard license).
The following widgets are hidden by default. Enable them from the Customize menu (see Customizing the Dashboard below):
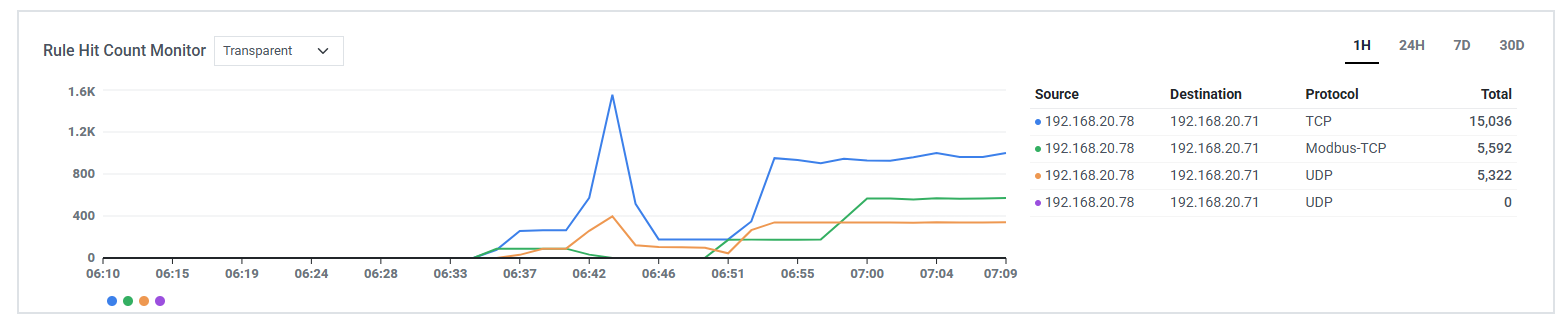
Rule Hit Count Monitor: Shows traffic activity for your firewall rules over time, with the top rules listed alongside the chart. Switch between Routing and Transparent rules, and select the time range (1H, 24H, 7D, 30D).
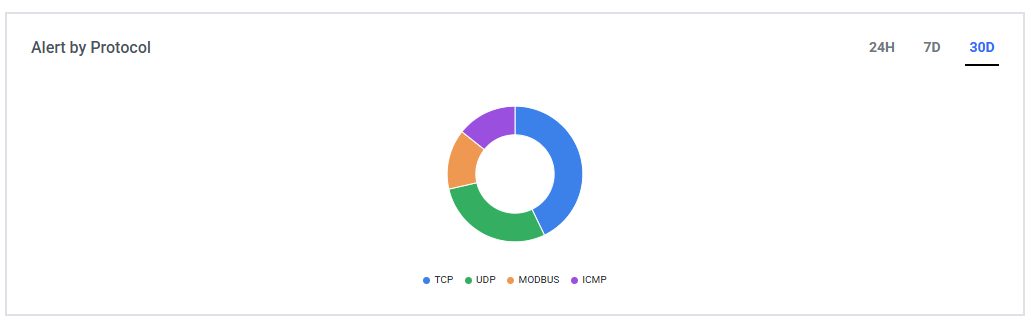
Alert by Protocol: Breaks down alerts by protocol so you can see which protocols are generating the most activity.
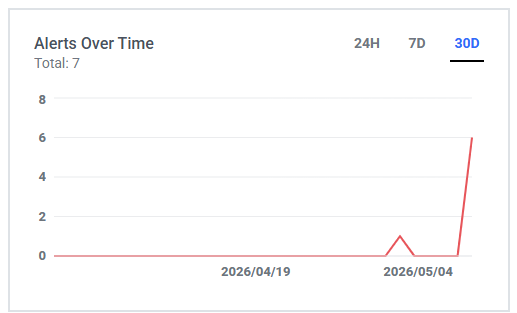
Alert Over Time: Plots the number of alerts over the selected period (24H, 7D, 30D).
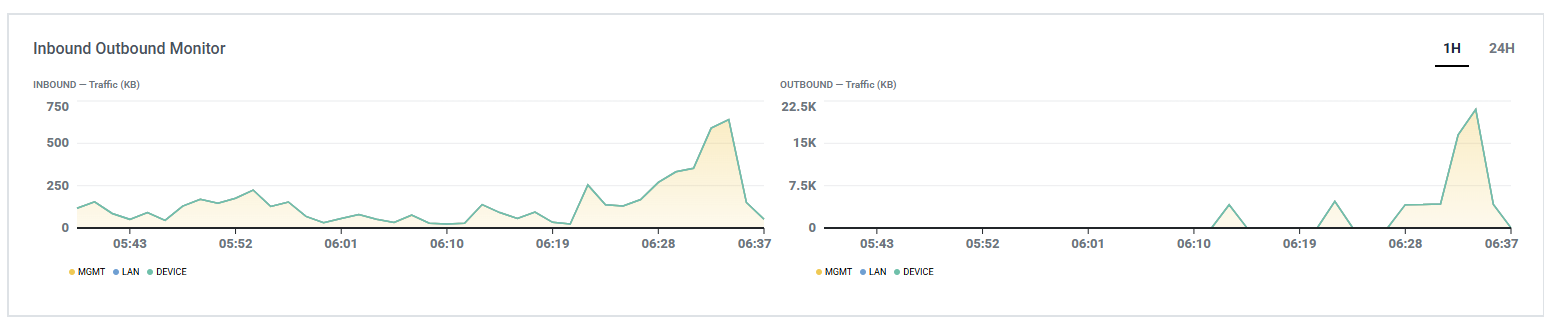
Inbound Outbound Monitor: Shows inbound and outbound traffic volume over the selected period (1H, 24H).
Customizing the Dashboard
You can arrange the Dashboard to suit how you work. Changes you make are kept until you save them, and the saved layout is restored the next time you open the Dashboard.
Resize a widget: Drag the right-hand edge of a widget to make it wider or narrower. The width snaps to the page's column grid; each widget has a minimum width.
Move a widget: Click and hold a widget, then drag it to a new position. Drop it onto another widget to swap their places, or into one of the highlighted empty slots that appear while dragging.
Show or hide widgets: Select Customize in the toolbar, then check the widgets you want to display and clear the ones you want to hide. Select Apply to save, Reset to return to the default arrangement, or Cancel to discard your changes.
Saving your layout: Resizing and moving widgets directly on the page are not saved automatically. Save them by selecting Apply in the Customize menu, or by choosing Save when prompted as you leave the page with unsaved changes.
User menu
In the top-right corner, select the user menu (the dropdown under your account name). You will see the following options:
Reboot
Factory Reset
Power Off
Sign Out