Overview
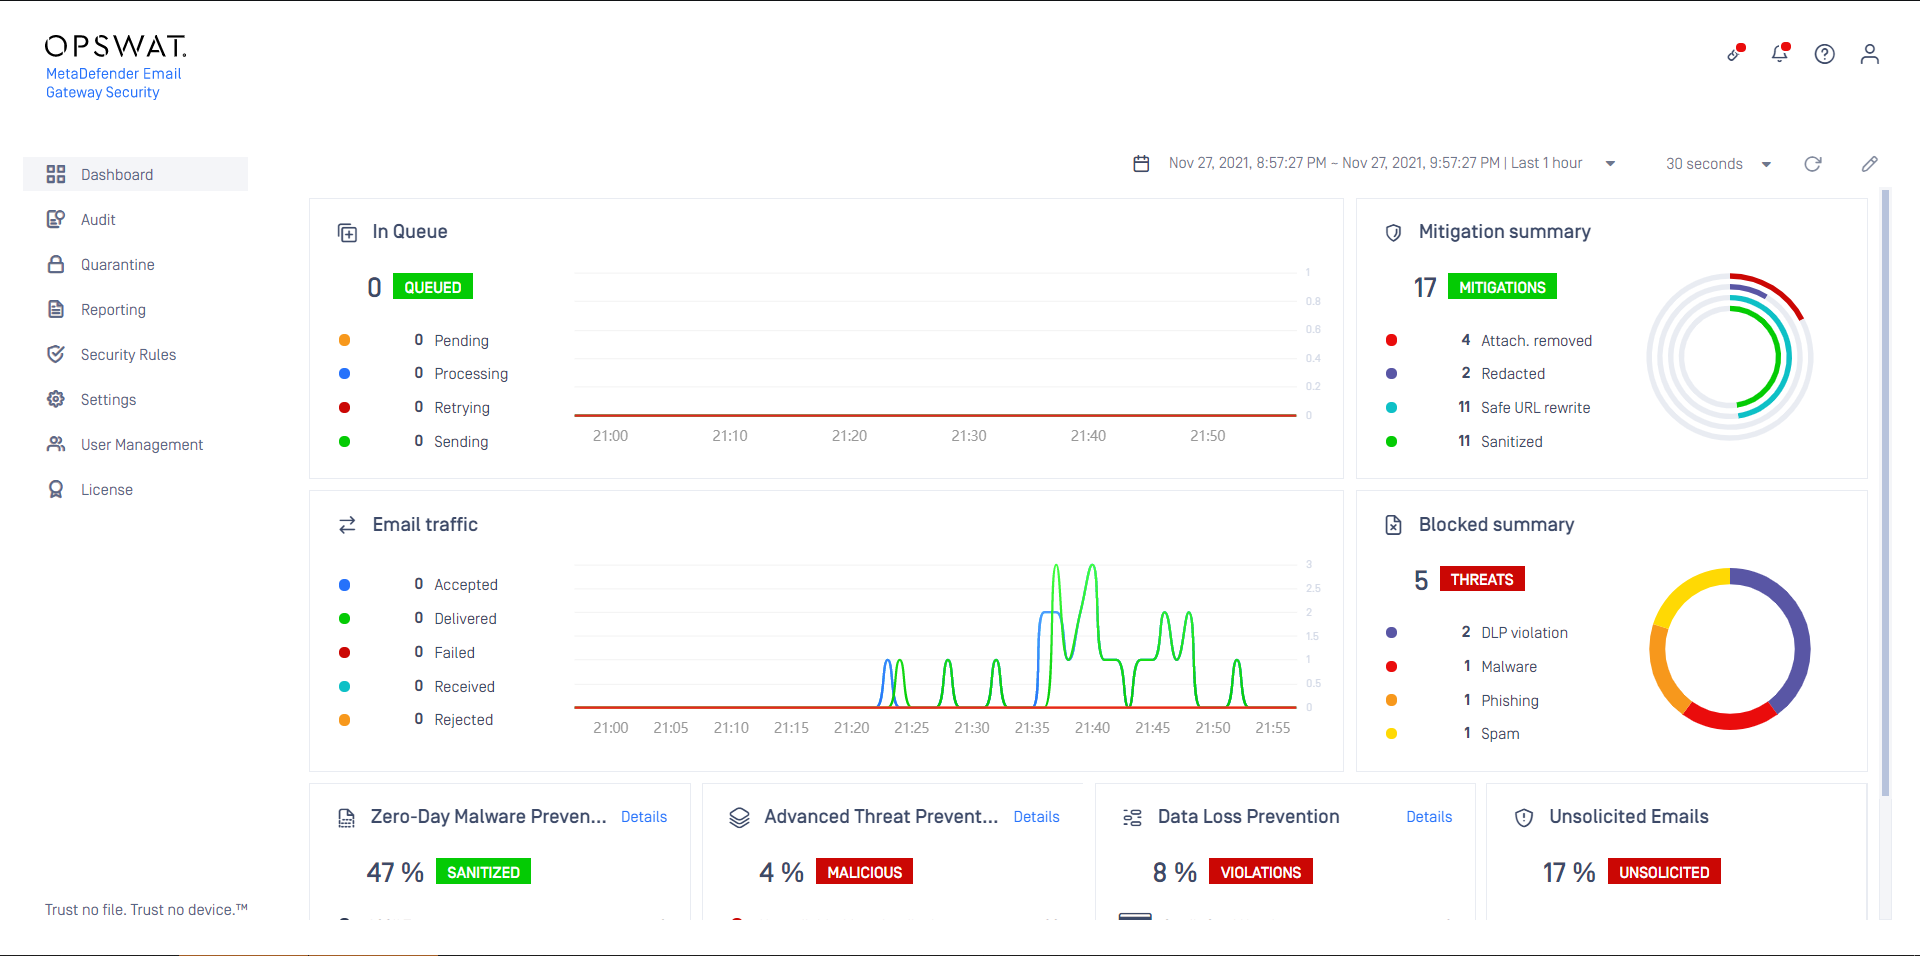
MetaDefender Email Gateway Security's Dashboard gives an overview about the email processing status.
The default refresh rate of the displayed information is 30 seconds.
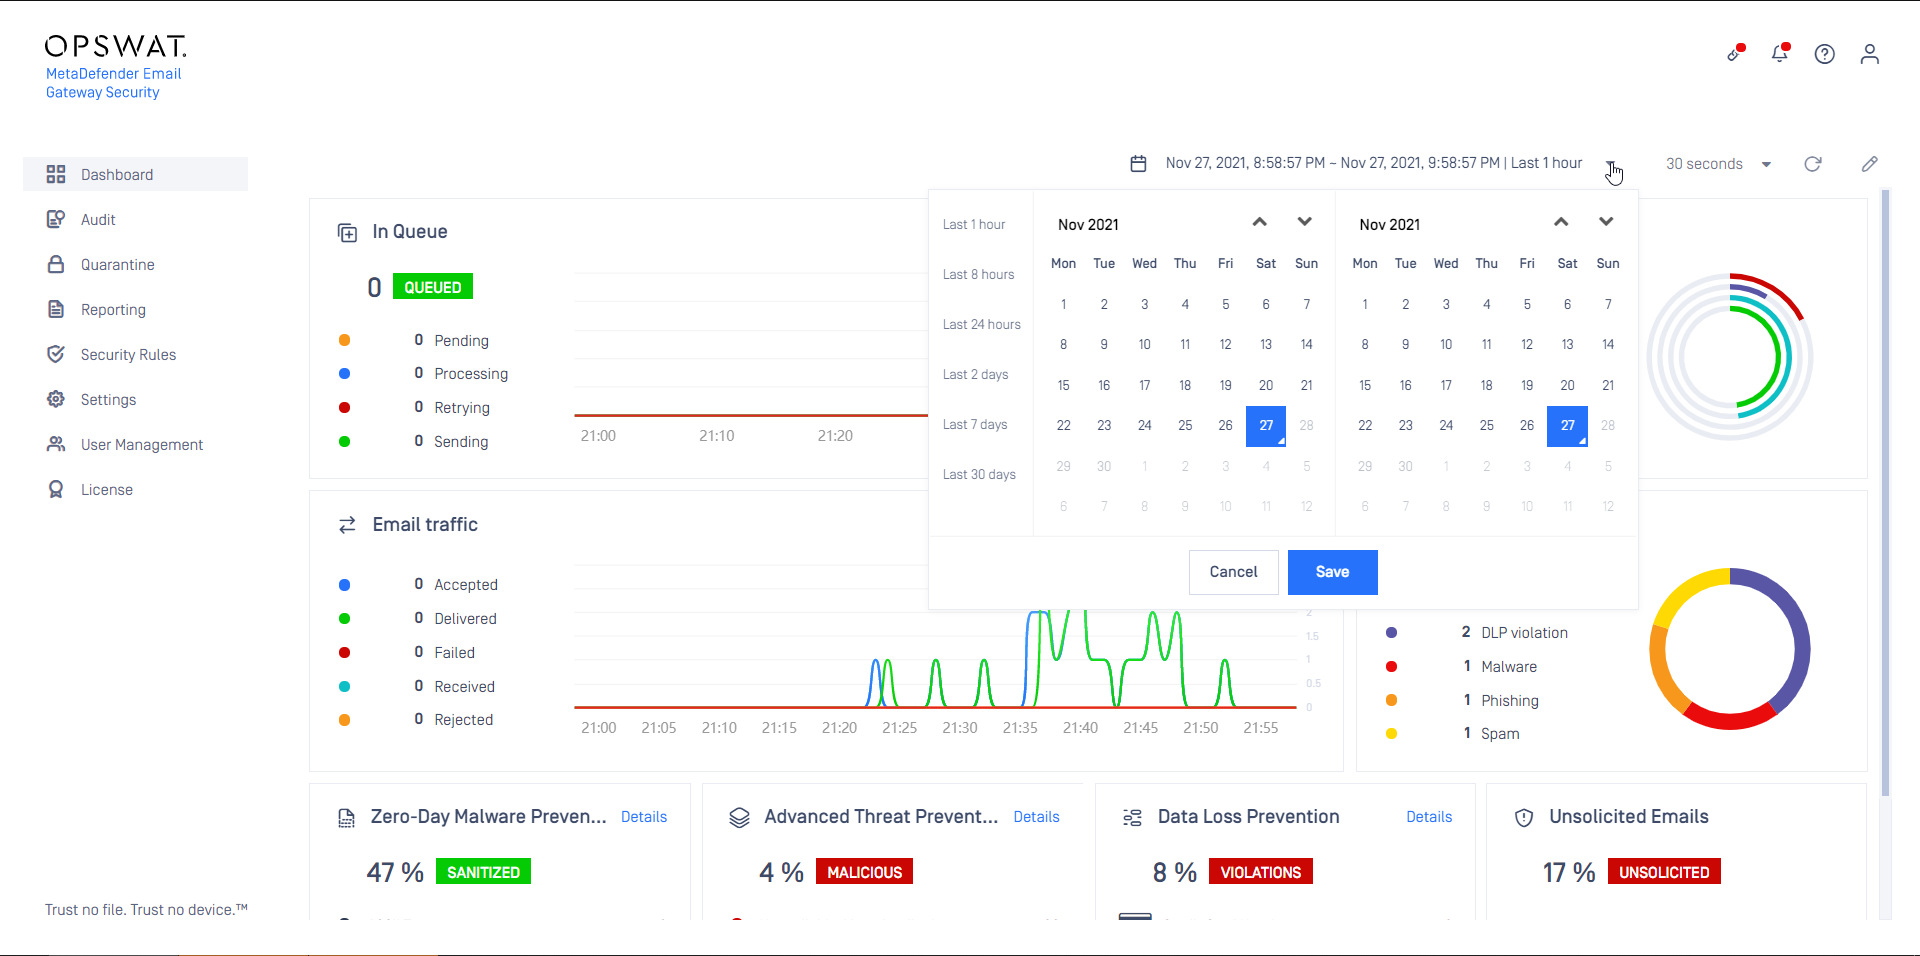
Time
The dashboard is always shown for the selected time window.
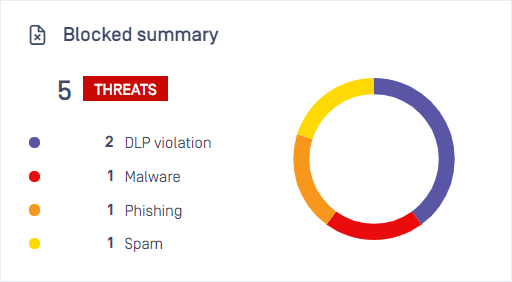
Summary widgets
Summary widgets represent data for the total time window.
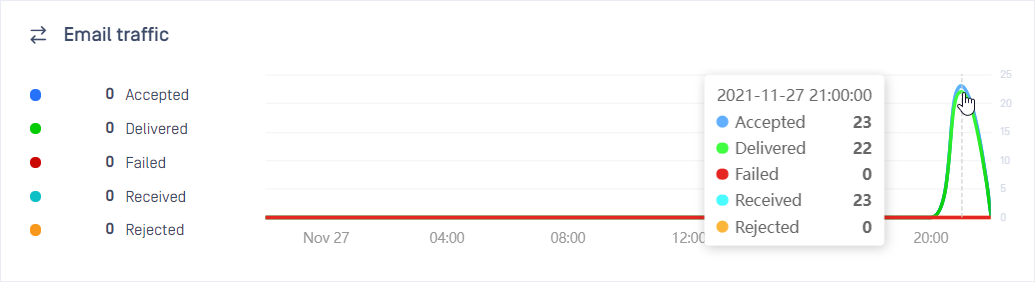
Line charts
Line chart widgets represent data for the entire period, broken down over time.

The list on the left side of the widget shows the values of the current minute or hour, depending on the actual resolution of the widget.
Resolution
The resolution of the line charts may be:
minutes, when the time window set for the dashboard is less than or equal to 8 hours,
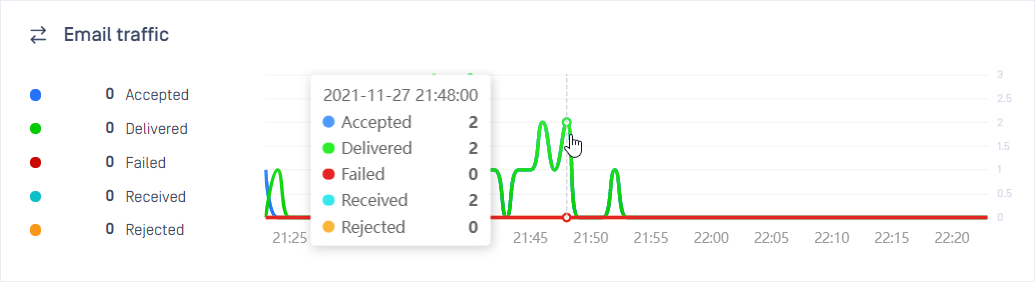
hours, when the time window set for the dashboard is more than 8 hours.
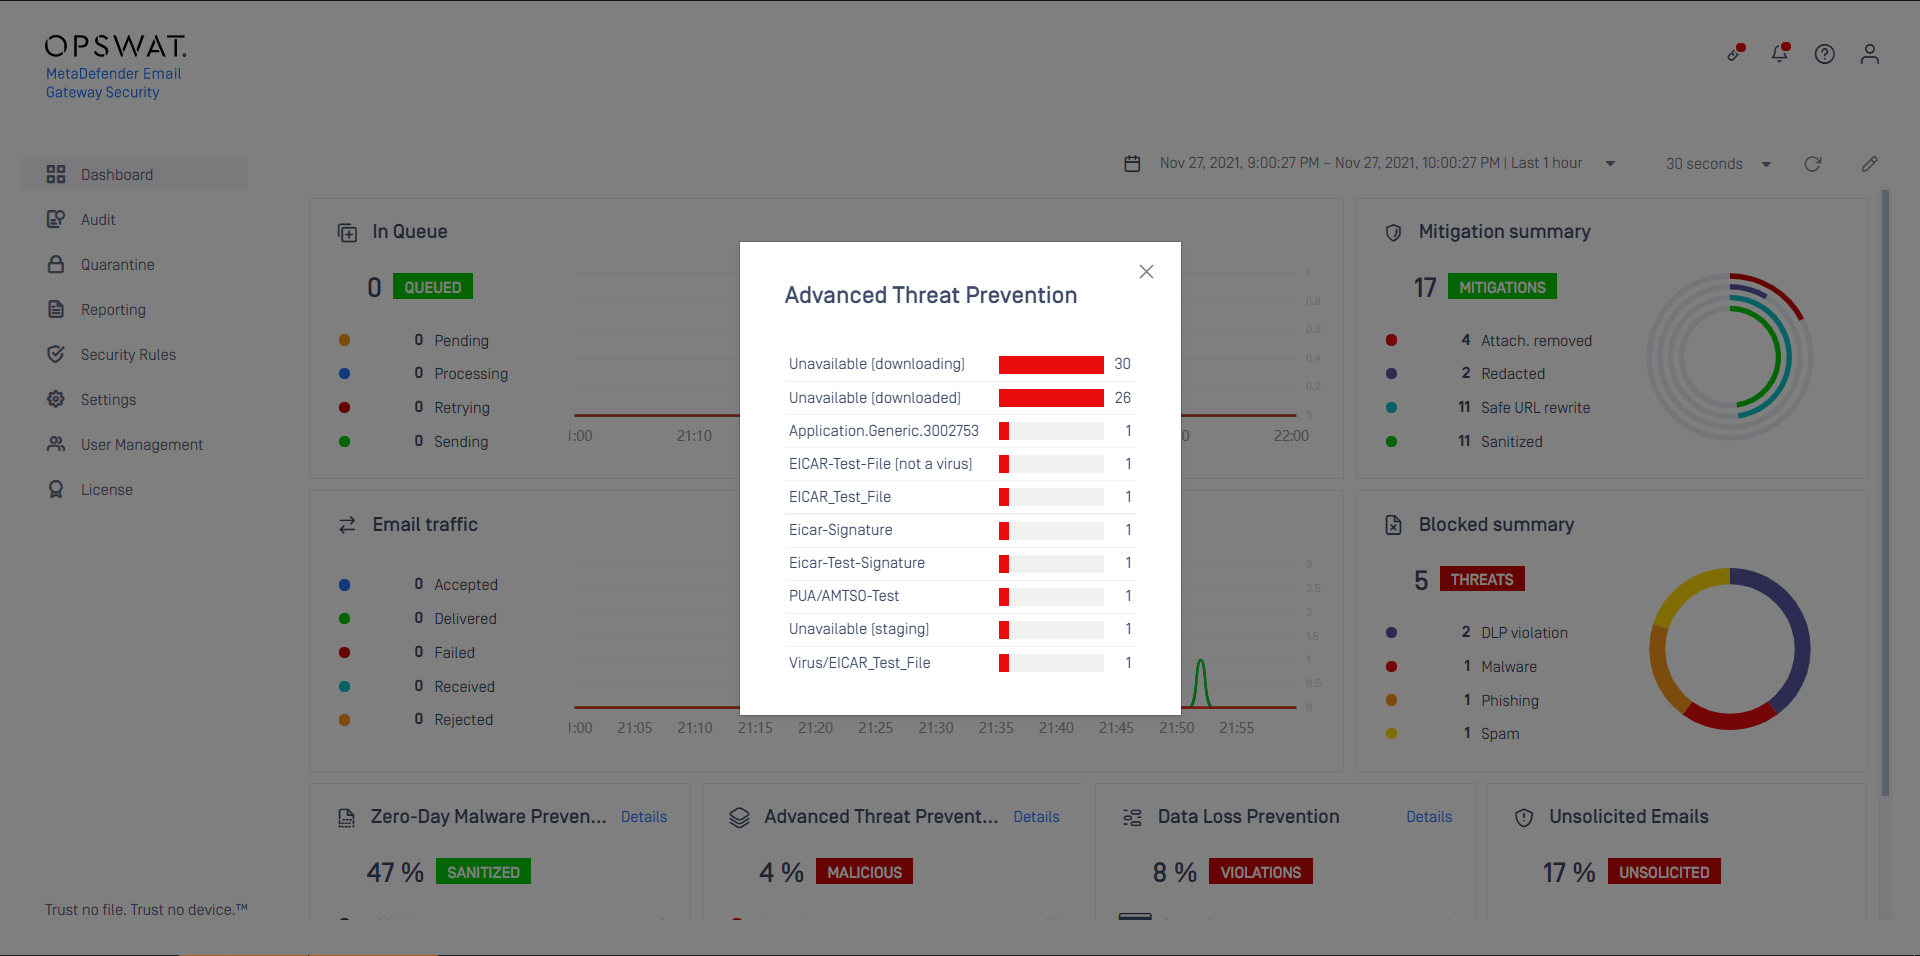
Statistics details
The Dashboard can show additional statistics information for certain widgets. When additional statistics are supported, then a Details link is present in the header of the widget.
For Zero-Day Malware Prevention, Advanced Threat Prevention and Data Loss Prevention, the bars represent each entry's share from the total.
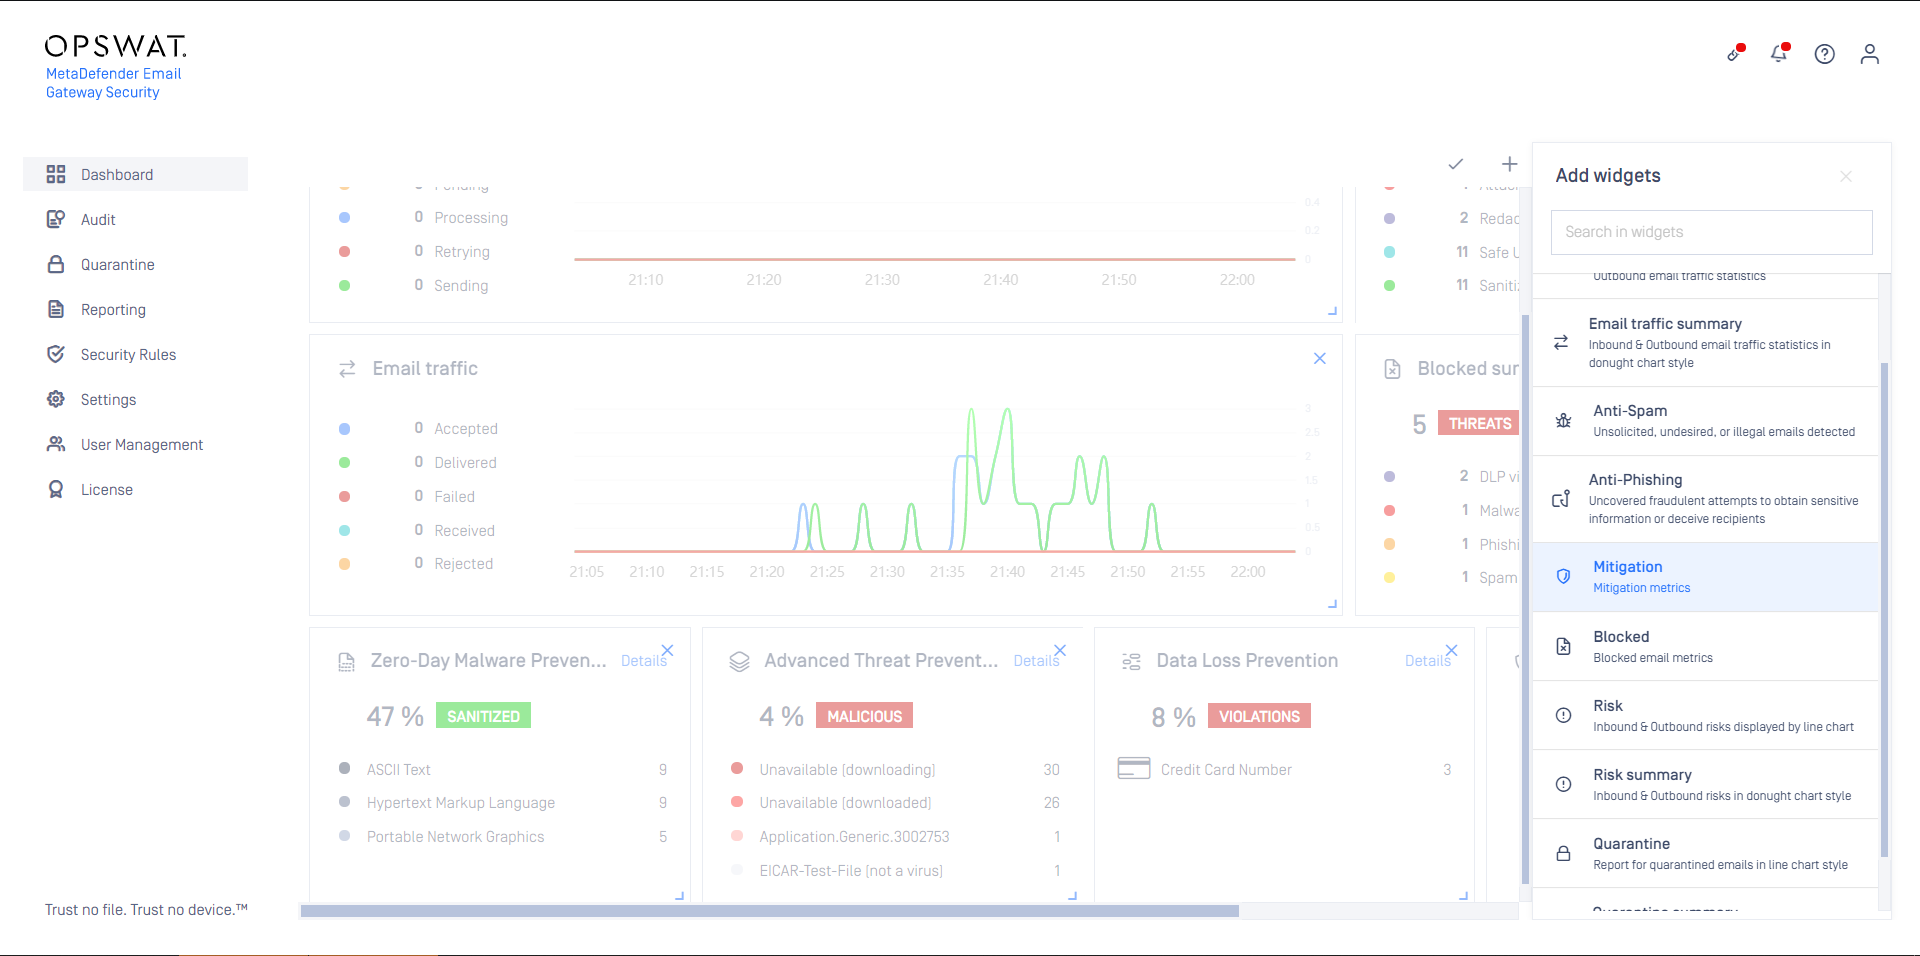
Customization
The Dashboard is customizable.
Each user can customize the dashboard for themselves. The custom configuration is stored with the user settings (for details see Configuration/Settings).
To customize the dashboard, click the button.
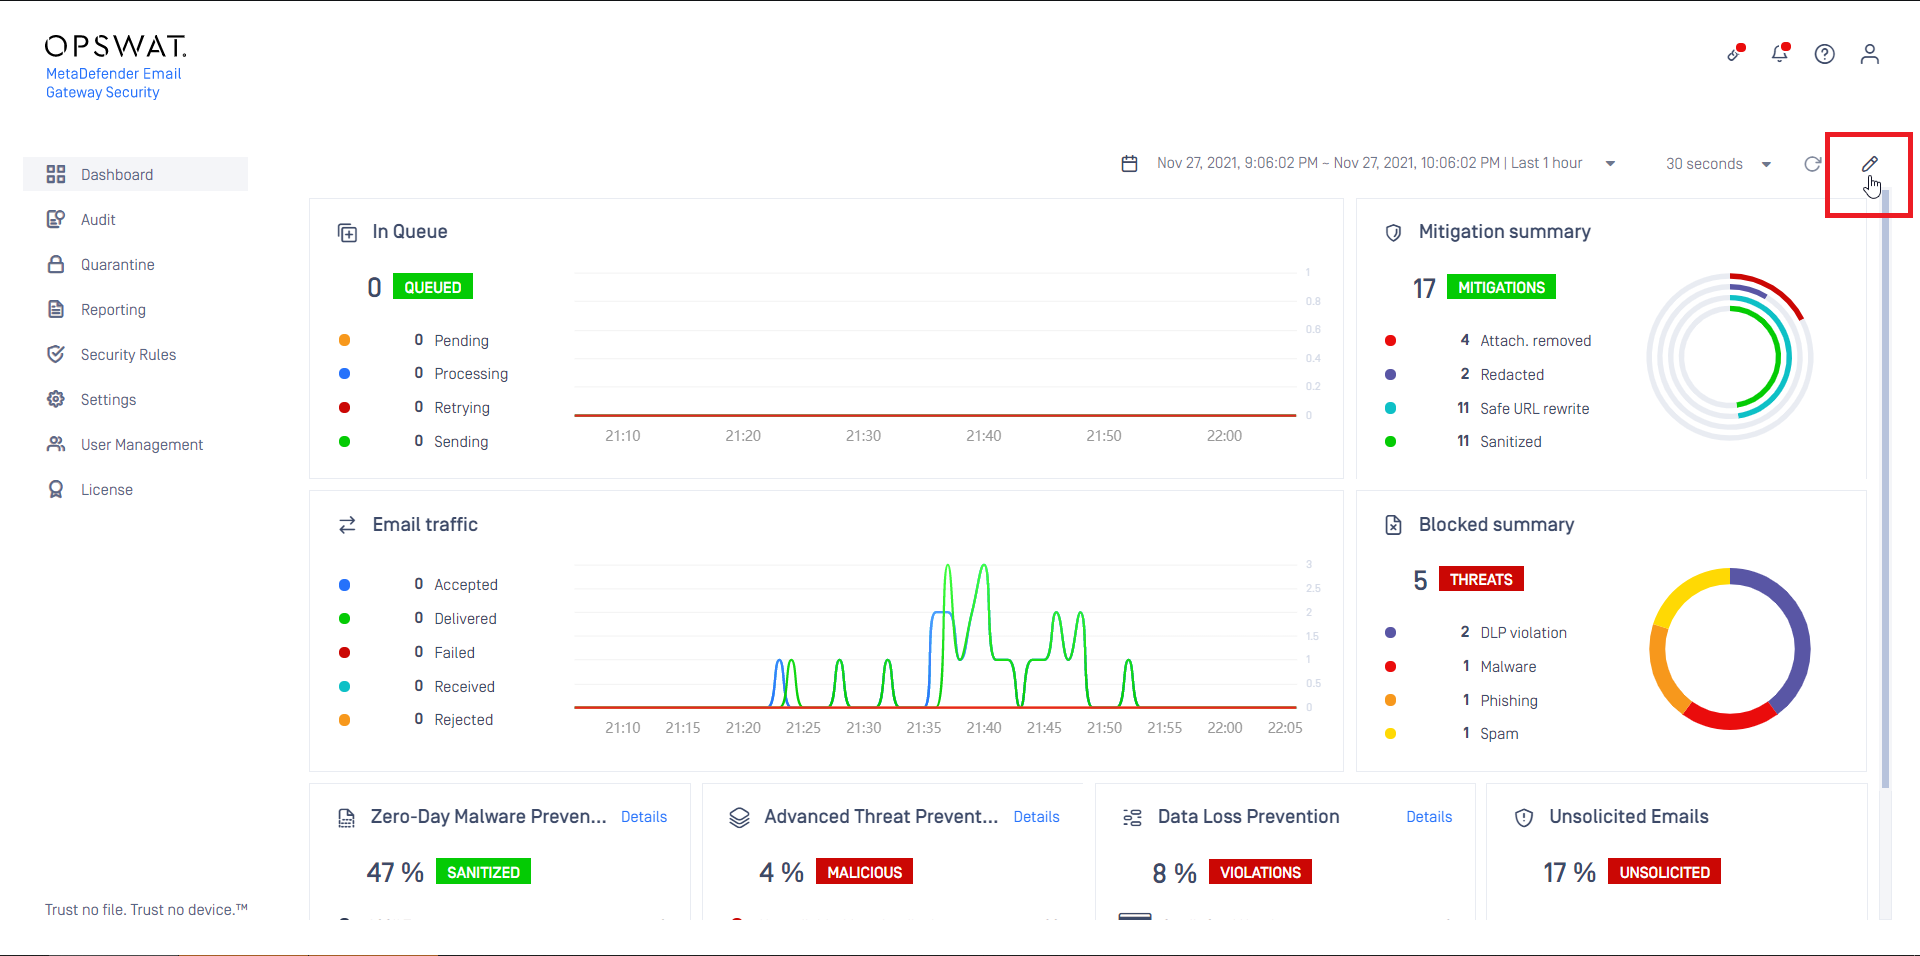
Widgets may be resized (), rearranged (), removed () or added (). When all customization is done, it can be applied clicking .