Performance and Load Estimation
These results should be viewed as guidelines and not performance guarantees, since there are many variables that affect performance (file set, network configurations, hardware characteristics, etc.). If throughput is important to your implementation, OPSWAT recommends site-specific benchmarking before implementing a production solution.
Factors that affect performance
MetaDefender Core version
MetaDefender Core engine package and configuration
- set of engines (which and how many)
- product configuration (e.g., thread pool size)
MetaDefender Distributed Cluster API Gateway version
System environment
- server profile (CPU, RAM, hard disk)
- client application location - remote or local
- system caching and engine level caching
Dataset
encrypted or decrypted
file types
- different file types (e.g., document, image, executable)
- archive file or compound document format files
file size
bad or unknown (assume to be clean)
Performance tool
Performance metrics
While processing files on the system, service performance is measured by various metrics. Some of them are commonly used to define performance levels, including:
| Performance metrics | Description |
|---|---|
| Number of processed objects per hour vs. Number of processed files per hour | On MetaDefender Core, meaning of “files” and “objects” are not the same.
The primary metric used to measure average vs peak throughput of a MetaDefender Core system is “processed objects per hour.” |
Submission load (number of successful requests per second) | This performance metric measures the load generated by a test client application that simulates loads submitted to MetaDefender Core. A submission is considered successful when the client app submits a file to MetaDefender Core and receives a dataID, which indicates that the file has successfully been added to the Queue. Submission load should measure both average and peak loads. |
| Average processing time per object | The primary metric used to measure processing time of a MetaDefender Core system is “avg processing time (seconds/object).” |
Total processing time (against certain data set) | Total processing time is a typical performance metric to measure the time it takes to complete the processing of a whole dataset. |
How test results are calculated
Performance (mainly scanning speed) is measured by throughput rather than unit speed. For example, if it takes 10 seconds to process 1 object, and it also takes 10 seconds to process 10 objects, then performance is quantified as 1 second per object, rather than 10 seconds.
- total time / total number of objects processed: 10 seconds / 10 objects = 1 second / object.
Dataset
| File category | File type | Number of files | Total size | Average file size |
|---|---|---|---|---|
| Document | DOC | 3,820 | 534 MB | 0.14 MB |
| Medium archive files | RPM CAB EXE | 50 | Compressed size: 2.8 GB Extracted size: 12.09 GB | Compressed size: 56.02 MB Extracted size: 0.036 MB |
| Big archive files | CAB | 4 | Compressed size: 2.9 GB Extracted size: 124 GB | Compressed size: 715 MB |
Environment
Topology
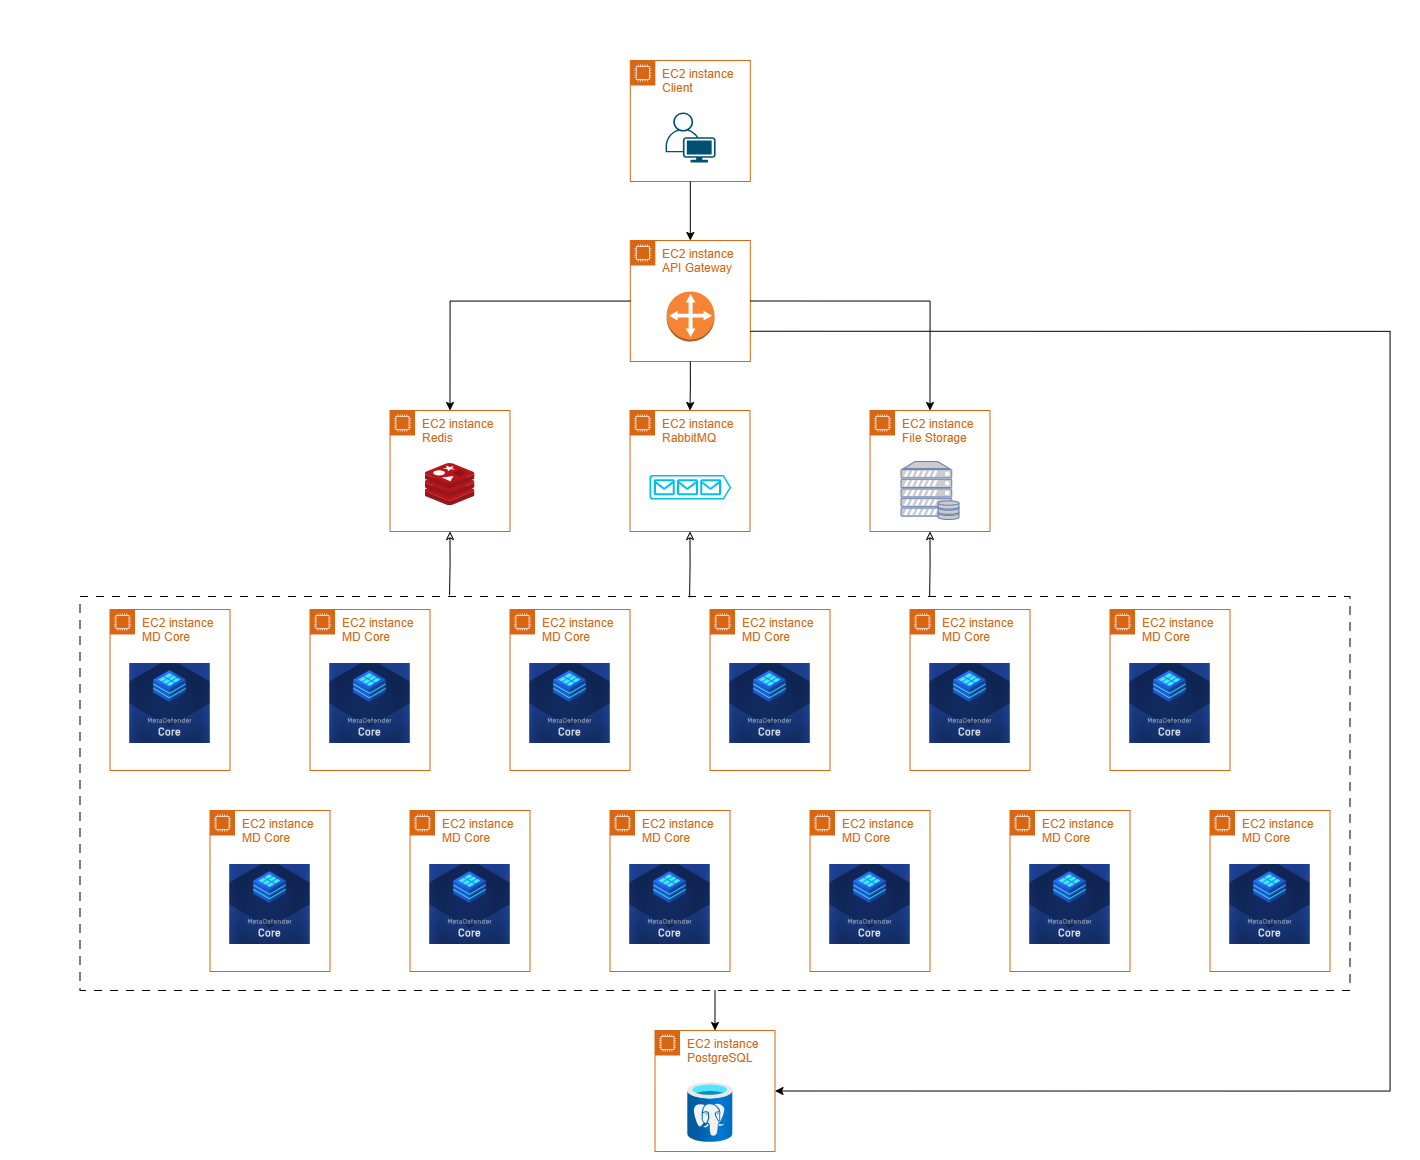
Using AWS environment with the specification below:
MDDC system
| MD Core | File Storage | API Gateway | PostgreSQL | RabbitMQ | Redis | |
|---|---|---|---|---|---|---|
| OS | Windows Server 2022 | Rocky Linux 9 | Rocky Linux 9 | Rocky Linux 9 | Rocky Linux 9 | Rocky Linux 9 |
| AWS instance type | c5.2xlarge | c5n.4xlarge | c5n.2xlarge | c5.xlarge | c5.xlarge | c5.xlarge |
| vCPU | 8 | 16 | 4 | 4 | 4 | 4 |
| Memory | 16GB | 32GB | 8GB | 8GB | 8GB | 32GB |
Disk Type IOPS Throughput Size | gp3 3000 125MB/s 100GB | gp3 12000 1000MB/s 150GB | gp3 3000 256MB/s 100GB | gp3 10000 550MB/s 100GB | gp3 3000 125MB/s 80GB | gp3 3000 125MB/s 80GB |
| Network bandwidth (baseline & burst) | 2.5 Gbps 10 Gbps | 15 Gbps 25 Gbps | 5 Gbps 25 Gbps | 1.25 Gbps 10 Gbps | 1.25 Gbps 10 Gbps | 1.25 Gbps 10 Gbps |
| Benchmark (Geekbench) | EC2 c5.2xlarge | EC2 c5n.4xlarge | EC2 c5n.2xlarge | EC2 c5.xlarge | EC2 c5.xlarge | EC2 c5.xlarge |
Client tool
| Detail | |
|---|---|
| OS | Rocky Linux 9 |
| AWS instance type | c5n.xlarge |
| vCPU | 4 |
| Memory | 10GB |
| Disk | Type: gp3 IOPS: 3000 Throughput: 125MB/s Size: 80GB |
| Network bandwidth | Baseline: 5 Gbps Burst: 10 Gbps |
Product information
MetaDefender Core v5.14.2
Engines:
- Metascan 8: Ahnlab, Avira, ClamAV, ESET, Bitdefender, K7, Quick Heal, VirIT Explorer
- Archive v7.4.0
- File type analysis v7.4.0
MDDC Control Center v2.0.0
MDDC API Gateway v2.0.0
MDDC File Storage v2.0.0
PostgreSQL v14.17
RabbitMQ v3.12.6
Redis v7.2.1
MetaDefender Core settings
General settings
- Turn off data retention
- Turn off engine update
- Scan queue: 1000 (for Load Balancer deployment)
Archive Extraction settings
- Max recursion level: 99999999
- Max number of extracted files: 99999999
- Max total size of extracted files: 99999999
- Timeout: 10 minutes
- Handle archive extraction task as Failed: true
- Extracted partially: true
Metascan settings
- Max file size: 99999999
- Scan timeout: 10 minutes
- Per engine scan timeout: 1 minutes
Advanced settings
RabbitMQ
- RABBITMQ_SERVER_ADDITIONAL_ERL_ARGS=-rabbit consumer_timeout unlimited default_consumer_prefetch {false,525}
Redis
- redis-cli flushall
- redis-cli config set save ''
- redis-cli config set maxmemory 25gb
- redis-cli config set maxmemory-policy volatile-ttl
Performance results
Load-balance deployment vs MDDC deployment
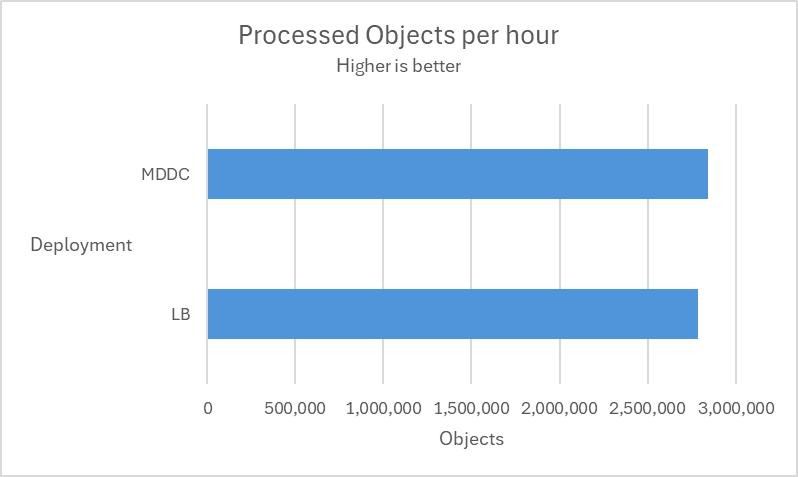
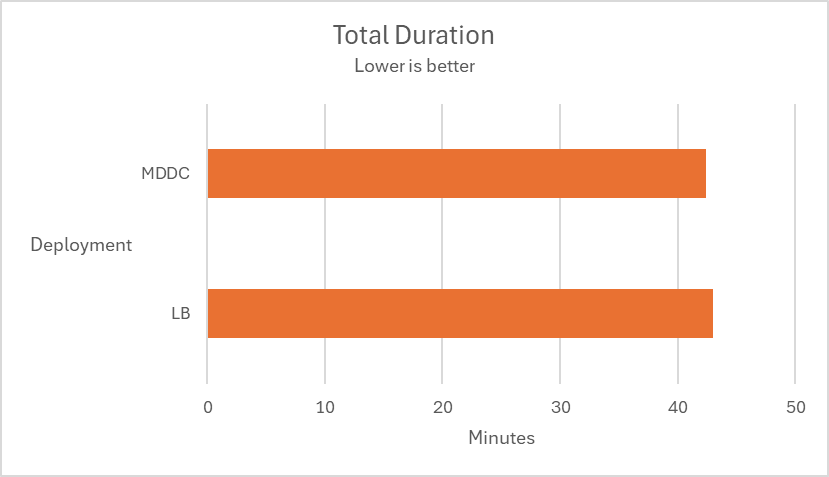
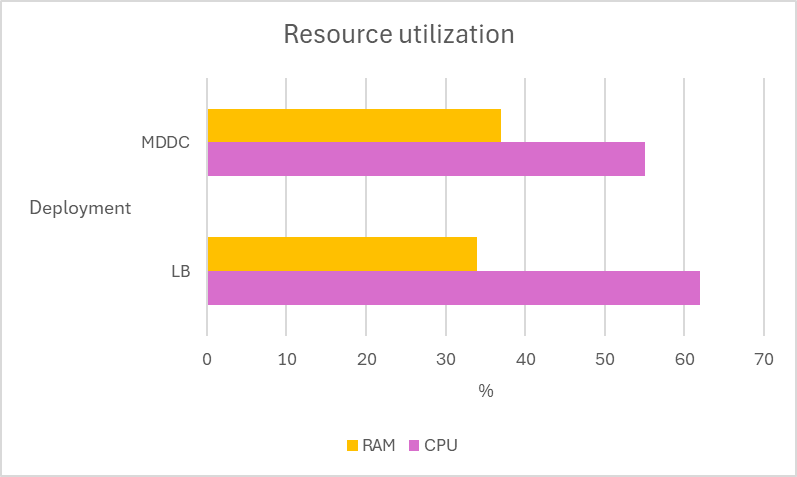
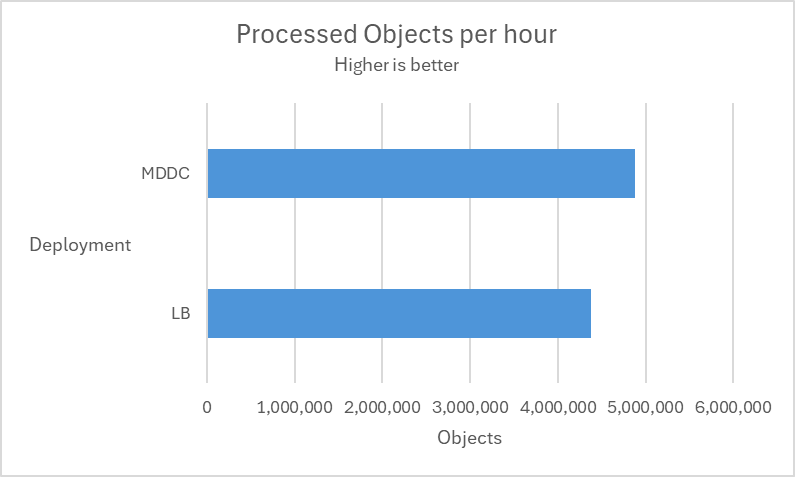
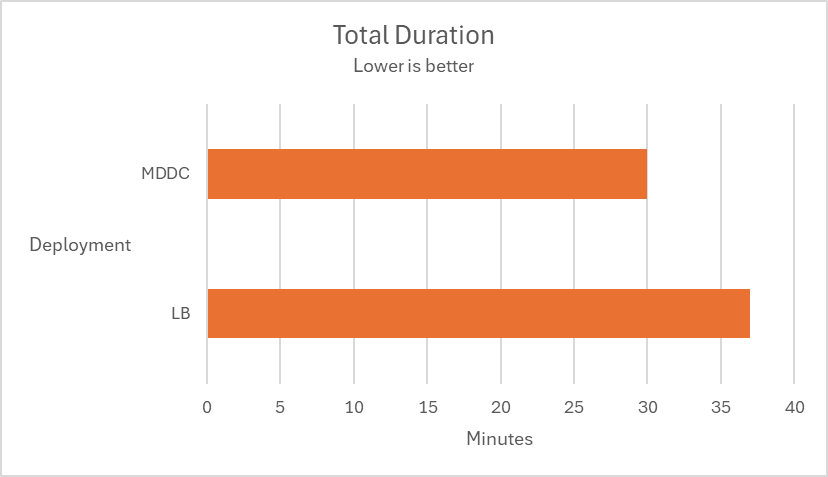
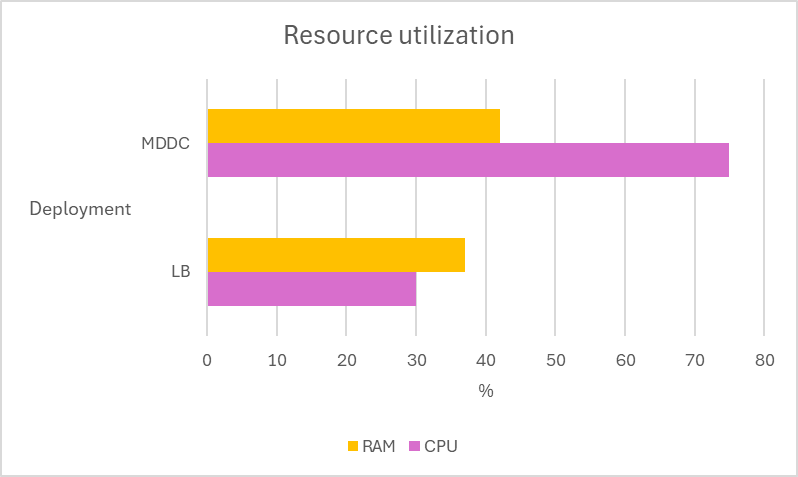
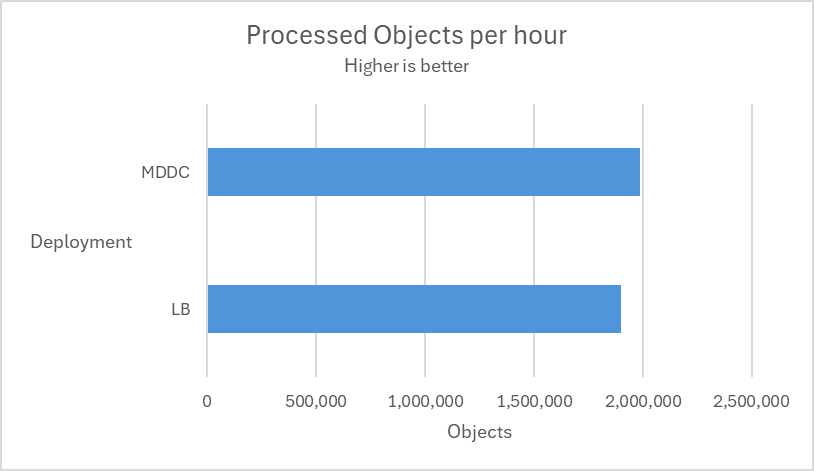
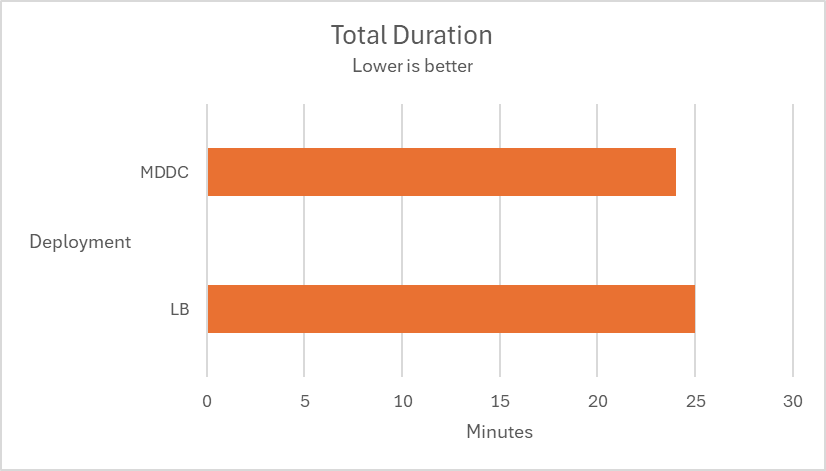
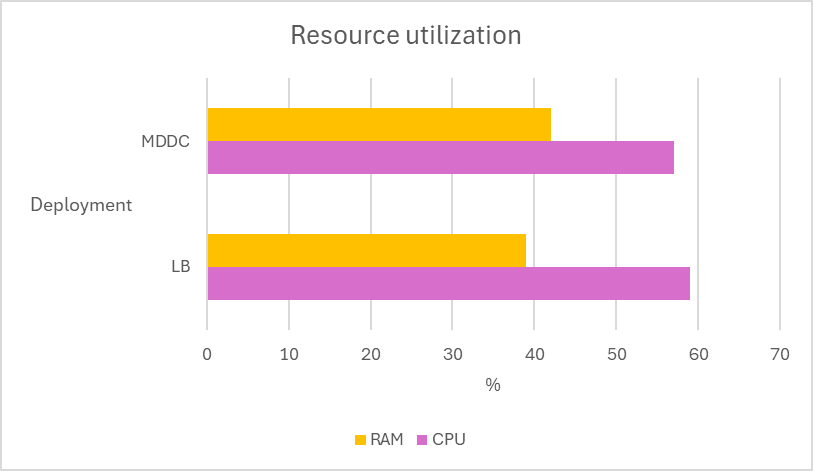
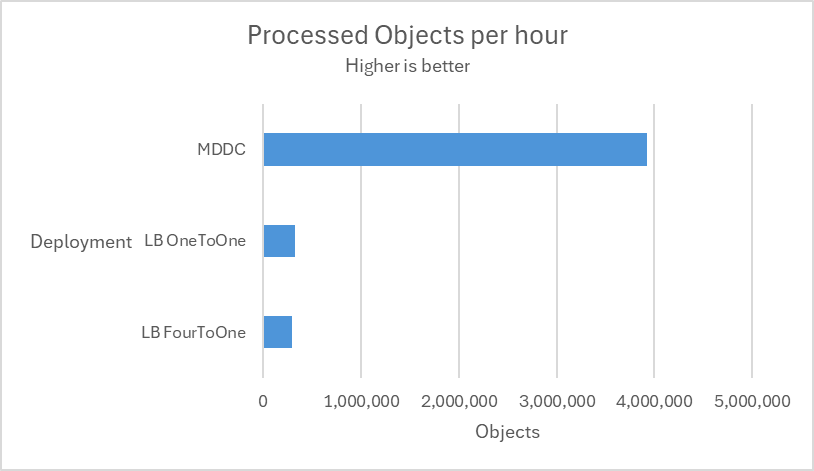
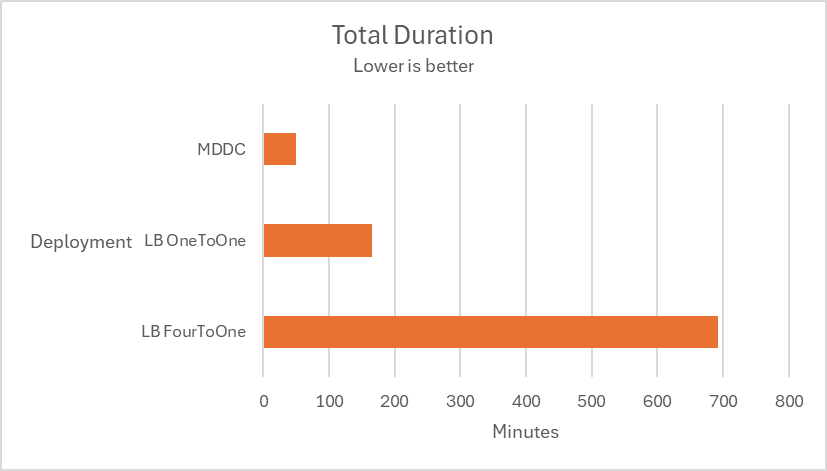
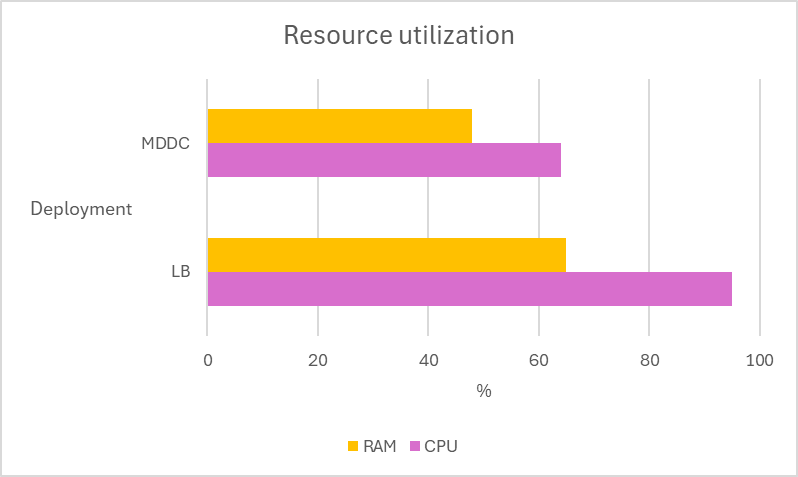
Multiple tests are conducted using 12 MetaDefender Core instances across two deployment types, MetaDefender Distributed Cluster (MDDC) and Load Balancer, to determine the superiority of the MDDC in 4 different datasets.
| Scenario | Result |
|---|---|
| Aggressively submitted 2M non-archive files at a rate of 800 files per second. |
|
| Submitted 400 medium archive files at a rate of 1 files per second. |
|
| Submitted a mix of 189K non-archive and medium archive files at a rate of 180 files per second. |
|
Submitted 4 large CAB files. The scenarios replicate 2 different routing cases of a common Load Balancer. LB OneToOne: An ideal routing ensures that one CAB file is routed to a single MD Core. LB FourToOne: The worst routing that delivered four CAB files to a single MD Core. # Archive distribution In workflow, setting "Load shared among MetaDefender Core instances for archive processing" is enabled.
|
|
Scaling out
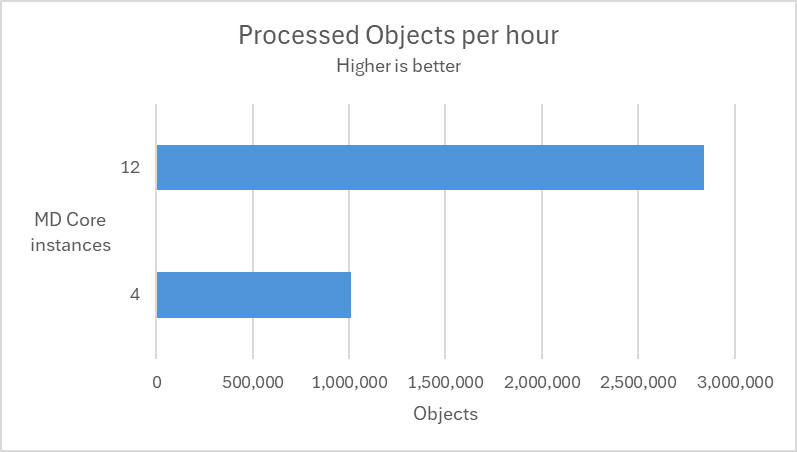
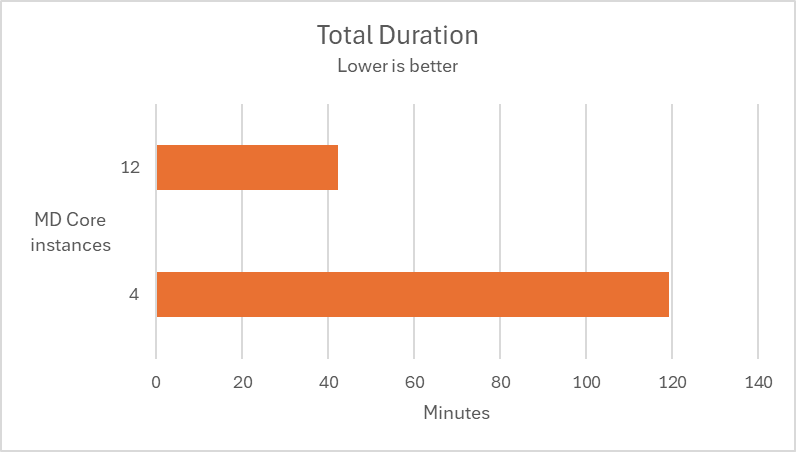
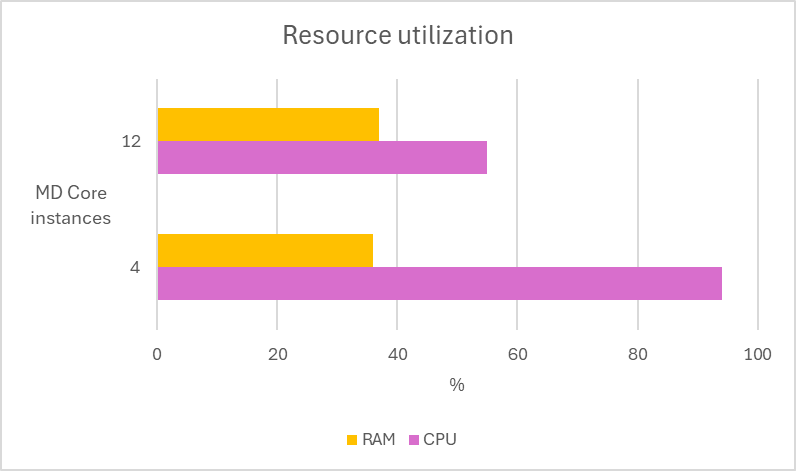
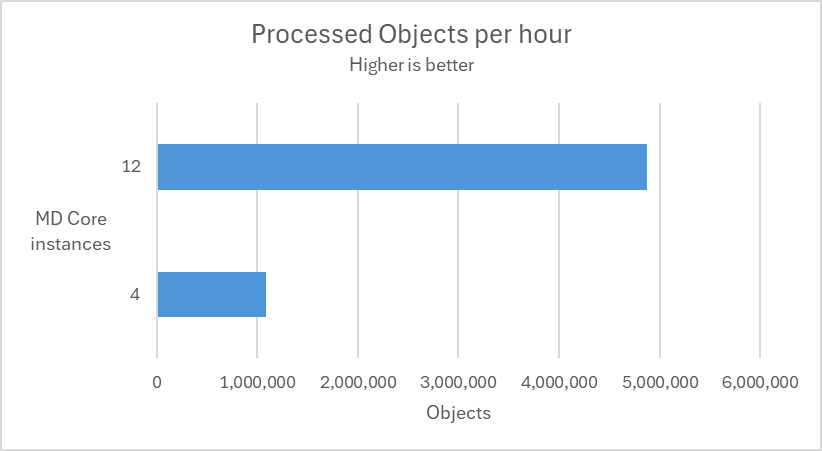
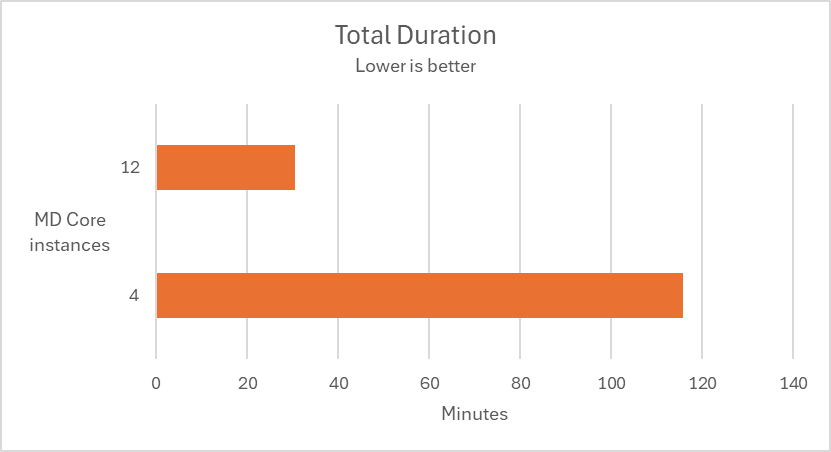
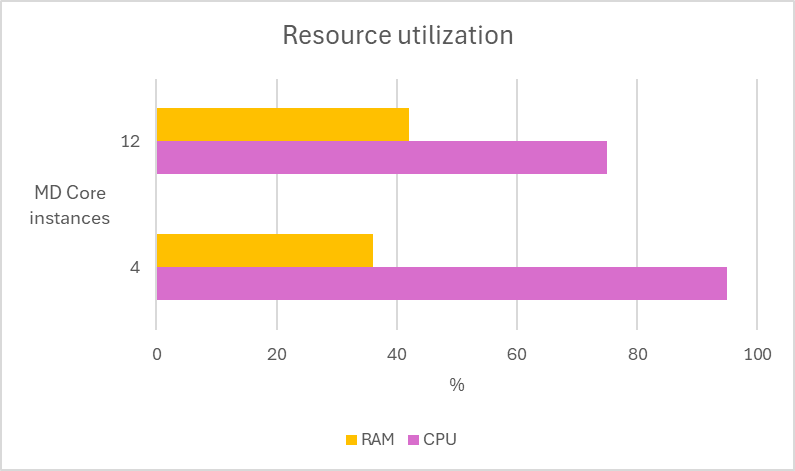
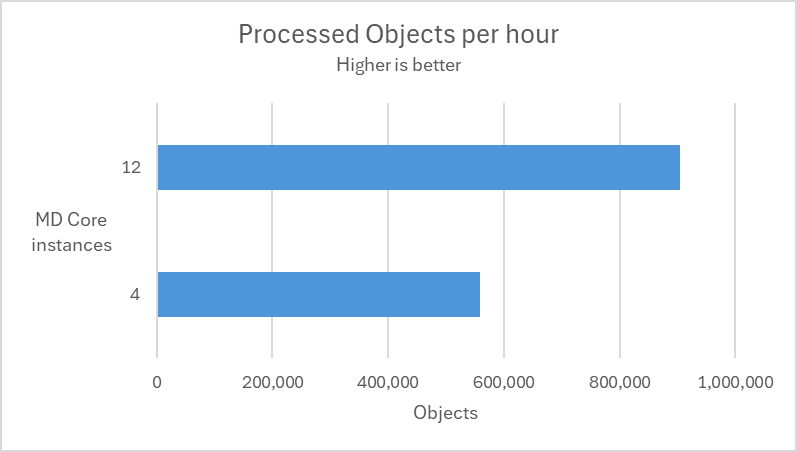
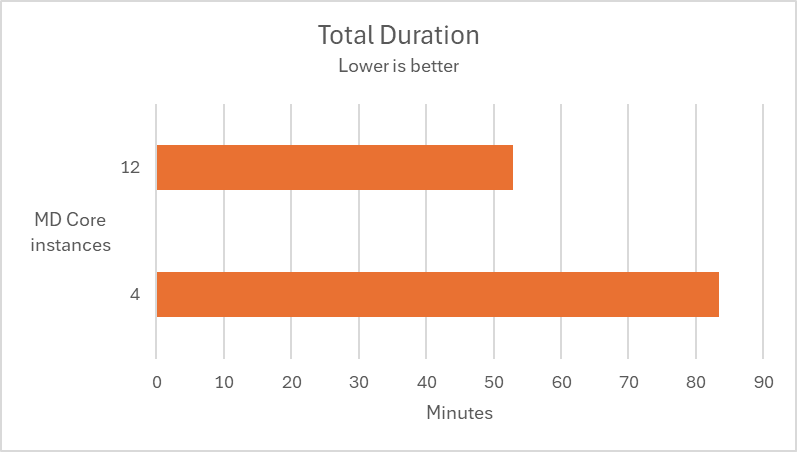
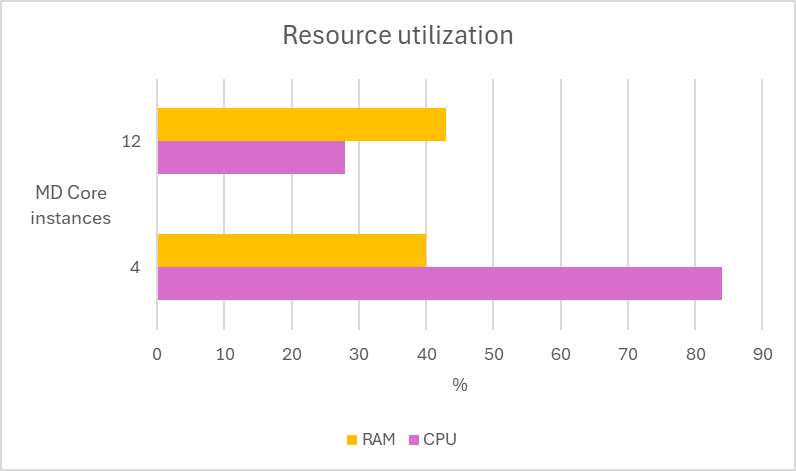
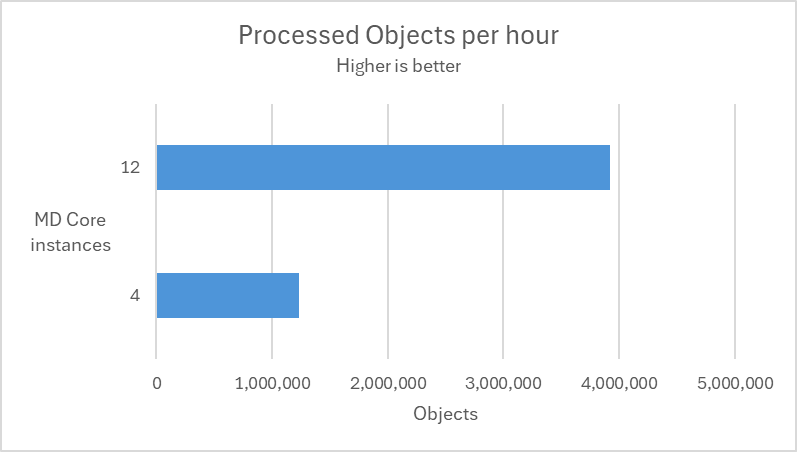
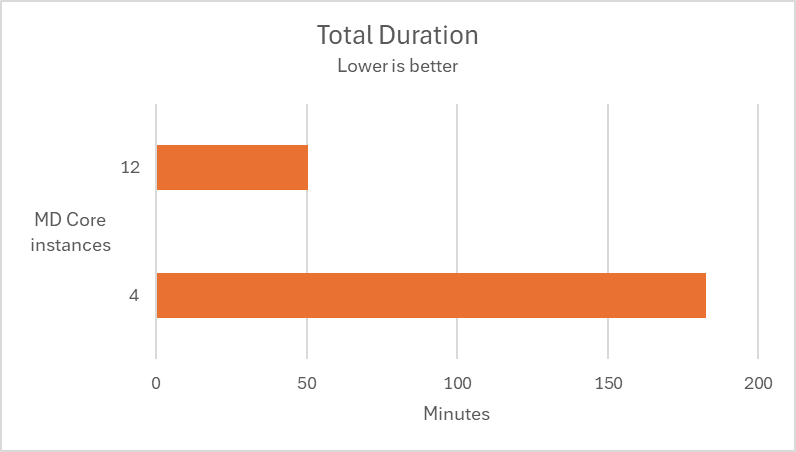
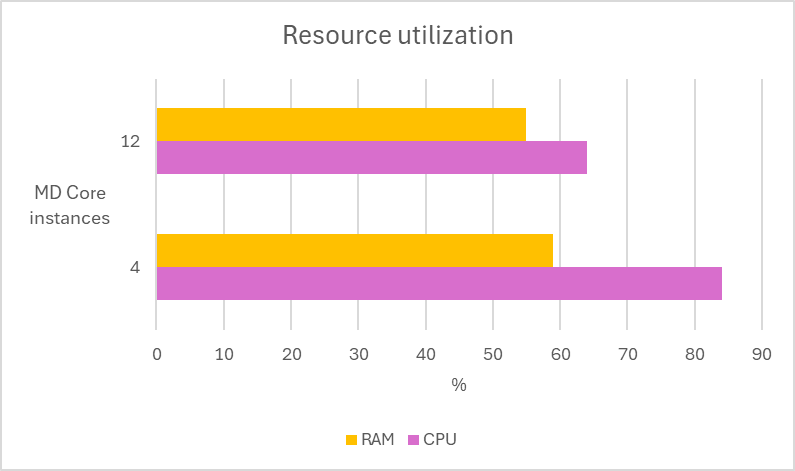
In the following test scenarios, we conducted experiments on four datasets using 4 and 12 of MD Core instances in MetaDefender Distributed Cluster (MDDC), demonstrating the benefits of increased instance counts.
| Scenario | Result |
|---|---|
| Aggressively submitted 2M non-archive files at a rate of 800 files per second. |
|
| Submitted 400 medium archive files at a rate of 1 files per second. |
|
| Submitted a mix of 189K non-archive and medium archive files at a rate of 60 files per second. |
|
Submitted 4 large CAB files. Archive distribution In workflow, setting "Load shared among MetaDefender Core instances for archive processing" is enabled.
|
|
