MetaDefender Cluster (MD Cluster) Control Center provides a Web-based user interface at default port 8892 for user to monitor the system health, system activity and executive report. These views are available under Dashboard > System Health, System Activity and Executive Report.
System Health
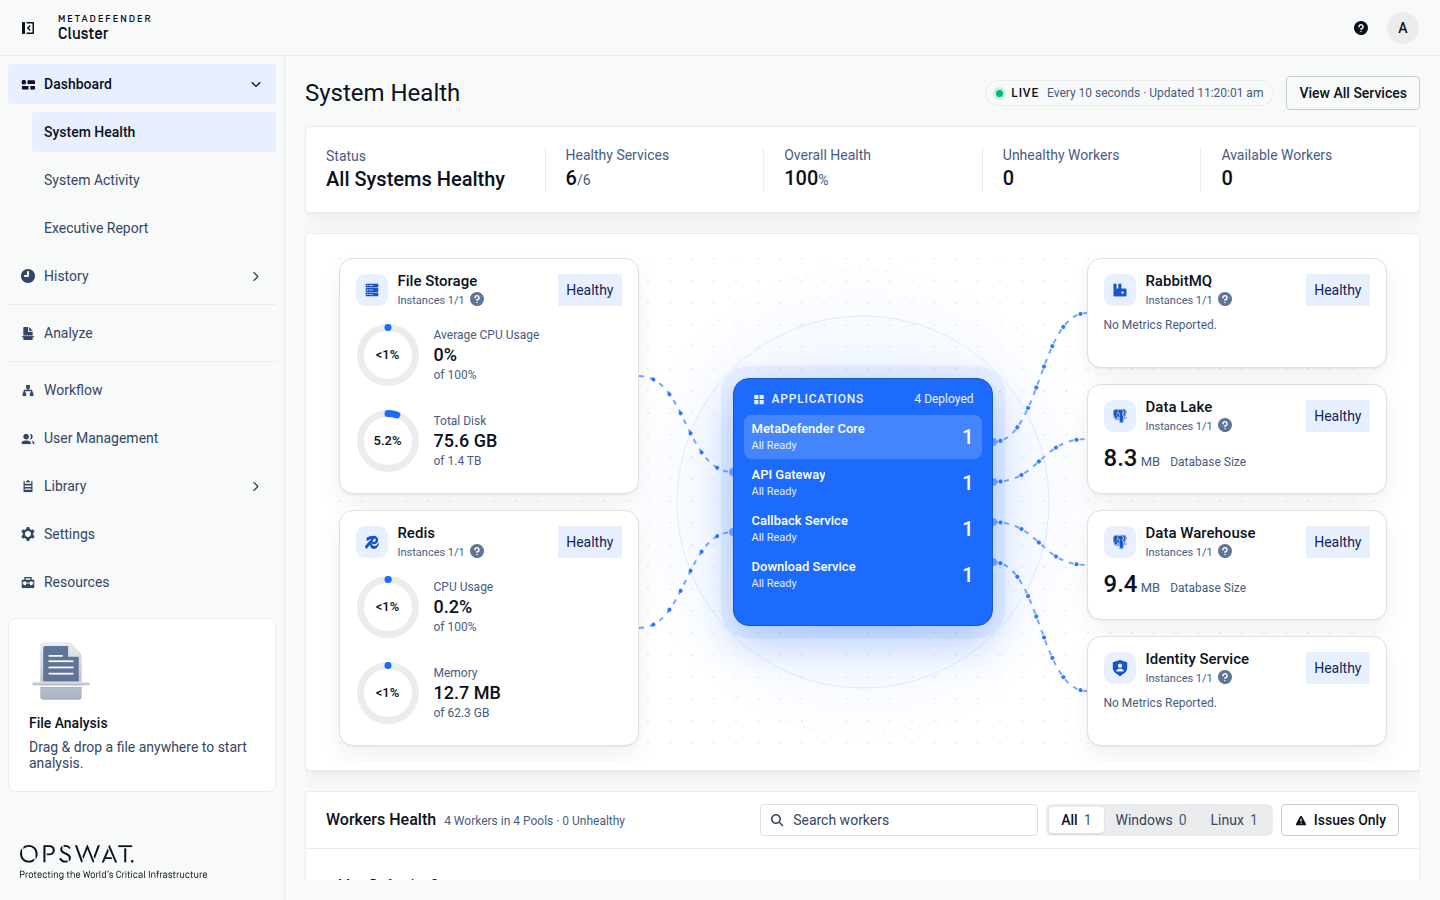
System Health show the status of all related services:
File Storage shows the number of MD Cluster File Storage instances in File Storage cluster added to MD Cluster. The average CPU usage by the instances and the available over total disk are displayed below.
Redis shows the number of Redis Caching services in MD Cluster. Only the CPU usage and free memory amount of the master Redis node are presented.
RabbitMQ shows the number of RabbitMQ message brokers in the cluster.
Data Lake and Data Warehouse each show the number of Postgres instances including the primary and its replicas. Database sizes are shown.
Identity Service shows the health status of the MD Cluster authentication/authorization service.
Workers Health
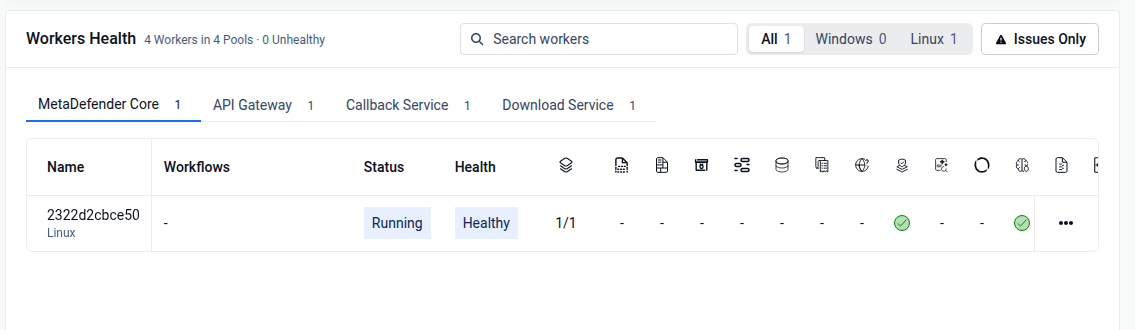
The Workers Health section at the bottom of the System Health page shows the overall health of all MetaDefender Core, MD Cluster API Gateway, MD Cluster Callback Service and Download Service instances, in one tab per type. The administrator can filter the list by Operating System (All, Windows, Linux) or show Issues Only, and can quickly monitor the engines installed on each MetaDefender Core instance.
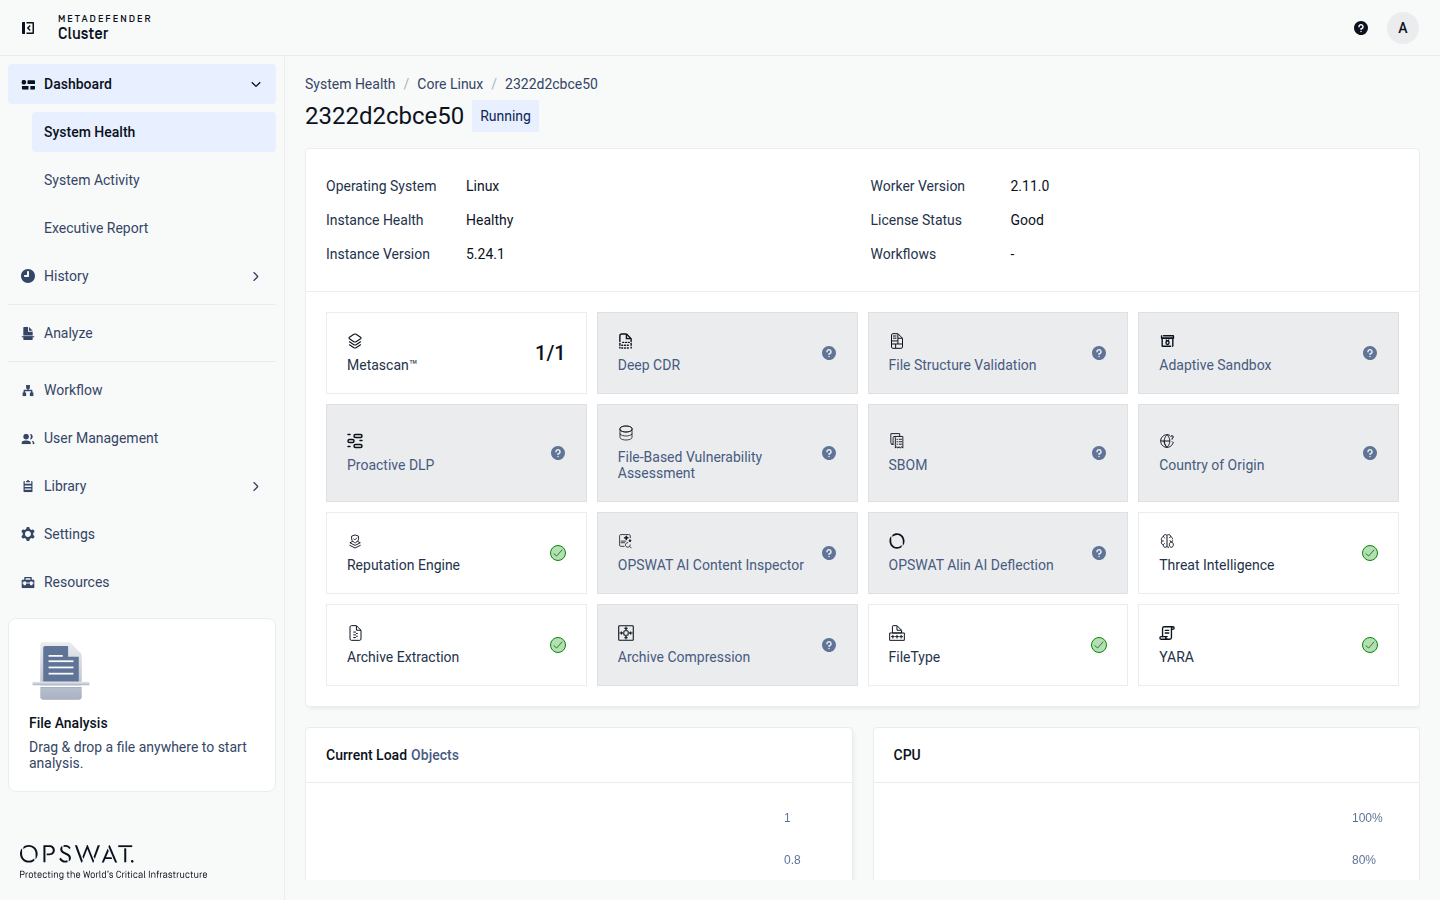
For more details of engines installed on any MetaDefender Core instance, the administrator can click the name of that instance. A details page for the instance is shown.
System Activity
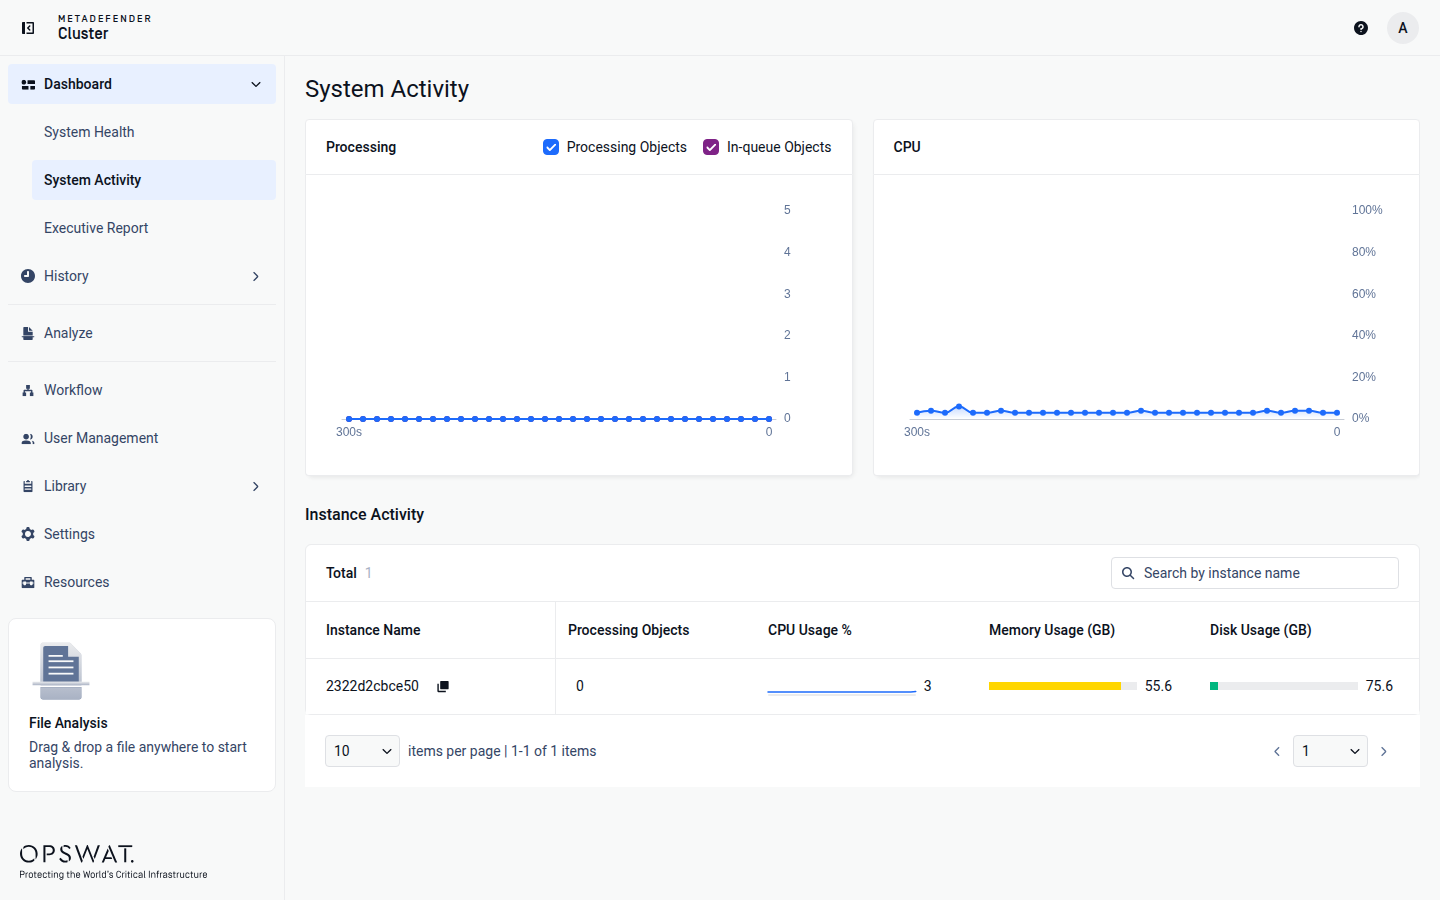
The overall System Activity of all MetaDefender Core instances are shown here. There are two sections of this page, Processing and Instance Activity.
Processing shows the overall objects currently being processed, objects currently in-queue and average CPU usage of all MetaDefender Core instances.
Instance Activity shows individual statistics of all MetaDefender Core instances. This includes Processing Objects, CPU Usage %, Memory Usage (GB) and Disk Usage (GB).
Executive Report
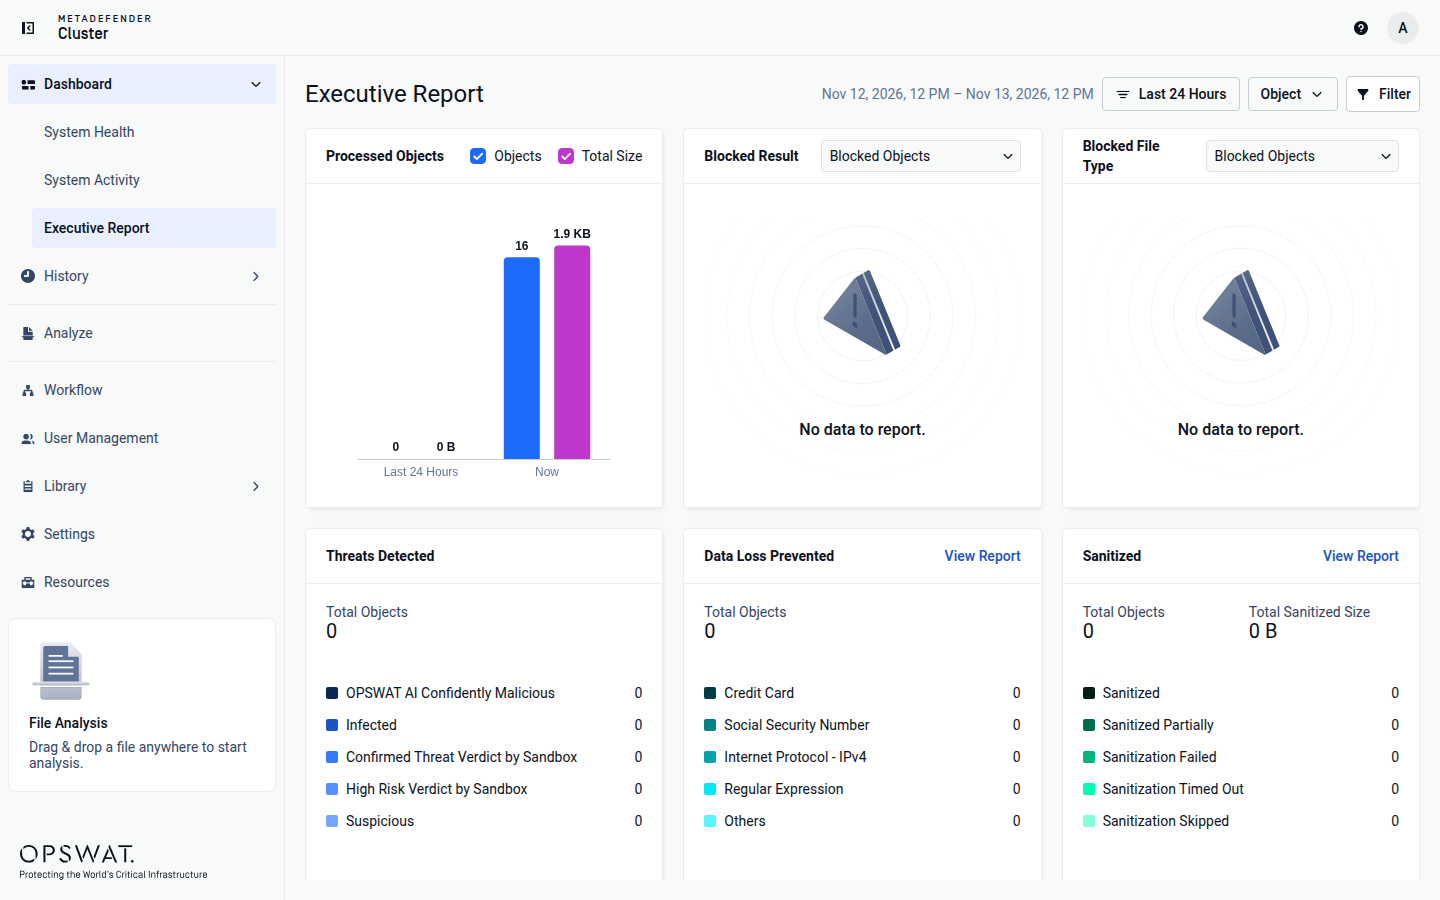
The Executive Report in MD Cluster provides statistical data on file scanning performance and metrics. This section will provide metrics and values to help you better understand your MetaDefender Cluster's performance.
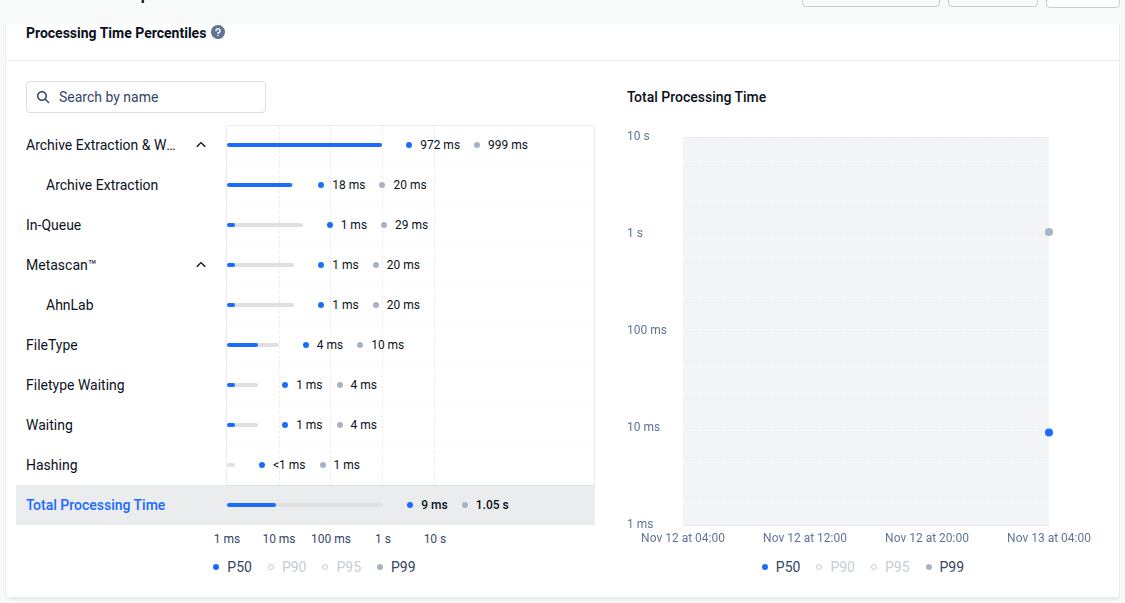
Processing Time Percentiles will provide detailed information regarding the Processing Stages. The P50, P90, P95 and P99 processing times will be shown for each stage, together with a Total Processing Time chart.
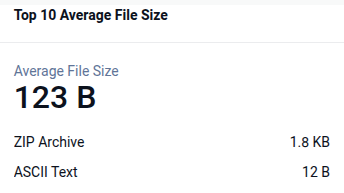
Top 10 Average File Size will provide detailed information on the average file size of file types that were commonly scanned.