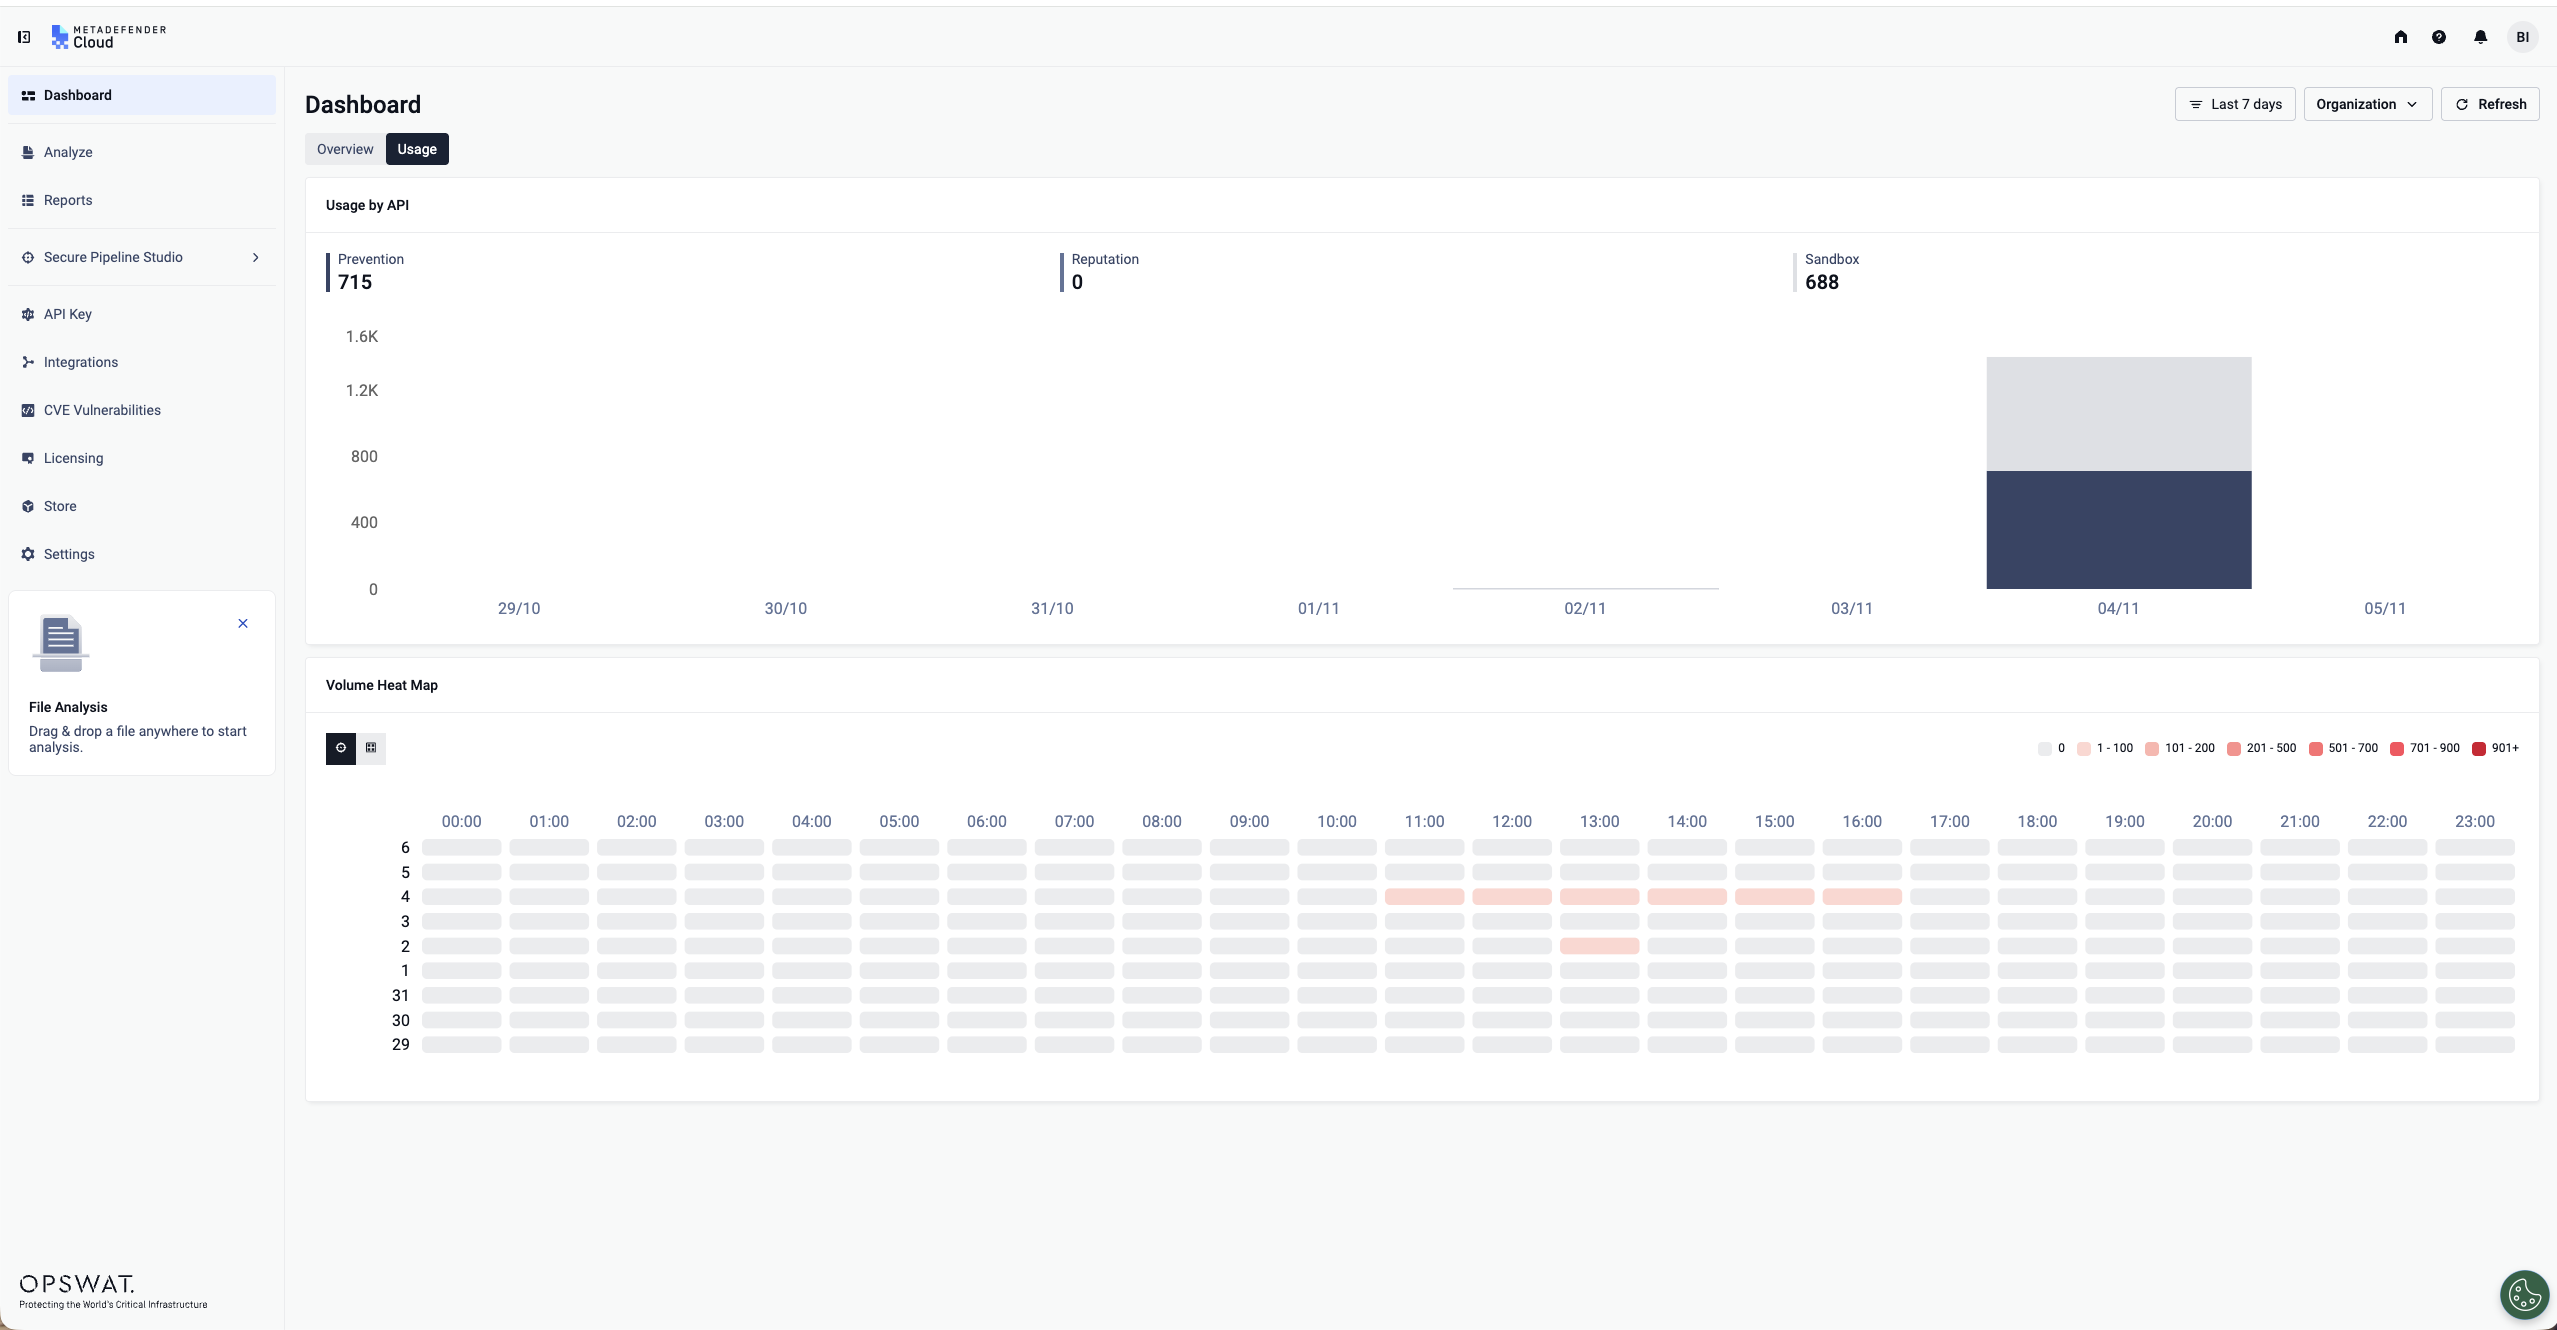
The Usage tab of the Dashboard shows how much of MetaDefender Cloud you have consumed — how many API calls you made, which API families they went to, and when they happened. Use it to see consumption trends, spot bursts, and check activity across your organization and its sub-organizations.
Where to find it
Sign in and open Dashboard from the left navigation, then select the Usage tab next to Overview. Direct link: www.metadefender.com/dashboard/usage.
Filters
The three controls in the page header apply to everything on the tab:
Control | What it does |
|---|---|
Date range | Sets the reporting period. Choose Last 7 days, Last 30 days, Last 90 days, Last 365 days, or Custom to pick your own start and end dates. |
Organization | Scopes the figures to one or more organizations. The menu lists your organization and each of its sub-organizations, with Select All to include everything. |
Refresh | Re-queries the data without reloading the page. |
Usage by API
Totals for the selected period, split across the three API families:
Prevention — file and URL analysis calls
Reputation — lookup calls
Sandbox — dynamic-analysis calls
Below the totals, a stacked column chart plots one column per day in the range. Hover a column to read a breakdown for that day — each API family and the combined Total. In the capture above, 4 November 2026 reads Prevention 713, Reputation 0, Sandbox 688, Total 1,401.
Volume Heat Map
A day-by-hour grid: one row per day in the range, one column per hour from 00:00 to 23:00. Each cell is shaded by how much volume fell in that hour, using the buckets in the legend — 0, 1–100, 101–200, 201–500, 501–700, 701–900, 901+. Hover a cell to reveal the exact count; the two icon buttons above the grid switch how the hover highlight behaves — one highlights the full row and column through the cell, the other highlights the surrounding block.
Use the heat map to find the hours your traffic actually lands in — useful when sizing a rate limit, scheduling a bulk job, or explaining a spike.