
By default, Sandbox log files are collected in the following folder from multiple system components:
A similar list of log files should be present in that folder:
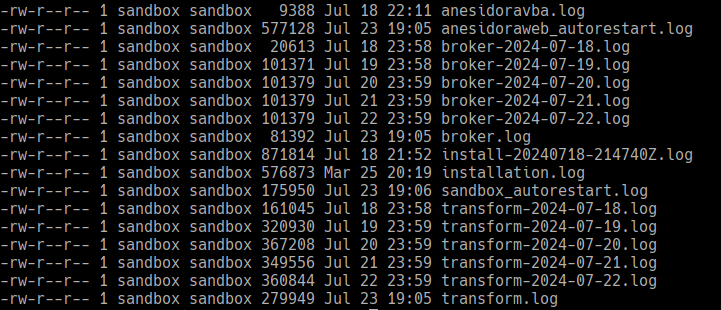
Note that log rotation is also used, so multiple log files will be present for a given component (most importantly for broker and transform).
You can open any of these files in a text editor of your choice.
To view the colorized transform logs in real time, use the sblog command in your shell. This should work for all users, but a sudo password might be needed if a given user does not have read access to /home/sandbox/sandbox/logs/transform.log:
To view the colorized broker logs in real time, use the sblog command with the -b argument:
The implementation of sblog is the /usr/local/sbin/sblog bash script.
This script calls multitail on the given logfile using the sandbox color scheme. You might use the same command on any logfile that you would like to view in real time:
Logs generated by different Sandbox components
Installation logs
logfile name: install-yyyyMMdd-HHMMssZ.log
logfile location: <sandbox_install_folder>__/logs
encoding: UTF-8
logfile format: text
content: log messages collected when running install.sh
log message format: No strict format, the output of various tools are logged
example log message:
Transform logs
logfile name: transform.log and anesidoravba.log
logfile location: <sandbox_install_folder>/logs/
logging framework: Log4j
encoding: UTF-8
logfile format: text (optional JSON)
content: generic log messages
supported log levels: FATAL, ERROR, WARN, INFO
defaut log level: INFO
log rotation:
filename format: transform -yyyy-MM-dd.log
rotation period: daily
maximum age: 30 days
log message format: "[%X{flow_id, uid}] %t %d %p %L [%c{1}] - n"
flow_id: primary scan identifier
uid: component level scan identifier
[%c{1}]: obfuscated class name
example log message:
Broker logs
logfile name: broker.log
logfile location: <sandbox_install_folder>/logs/
logging framework: Log4j
encoding: UTF-8
logfile format: text (optional JSON)
content: generic log messages
supported log levels: FATAL, ERROR, WARN, INFO
default log level: INFO
log rotation:
filename format: broker-yyyy-MM-dd.log
rotation period: daily
maximum age: 30 days
log message format: "[%X{flow_id, uid}] %t %d %p %L [%c{1}] - n"
flow_id: primary scan identifier
uid: component level scan identifier
[%c{1}]: obfuscated class name
example log message:
Autorestart logs
Docker container healthcheck and autorestart log entries.
logfile name: sandbox_autorestart.log and anesidoraweb_autorestart.log
logfile location: <sandbox_install_folder>/logs
encoding: UTF-8
logfile format: text
content: autorestart log messages
log message format: “yyyy-MM-dd hh:mm:ss - %message“
message: arbitrary message
example log message:
Docker container logs
Logs are created by docker for each container.
logfiles location: /var/lib/docker/containers/
this folder has a folder per container, named by container ID
each folder has a file {container-ID}-json.log
encoding: UTF-8
logfile format: JSON
content: generic log messages
default log level: INFO
log rotation:
on container restart
after reaching 1 GB size
log object format:
log: log message
stream: stream where message was streamed to (stderr by default)
time: time when log message was created
log message format: "%(asctime)s %(levelname)s: %(traceable_id)s%(message)s"
asctime: log message time
levelname: log level (INFO, WARNING, ERROR)
traceable_id: optional token to help trace log records, like [health:arq:scan_max_priority:long_run]
message: log message itself
example log object:
Nginx logs
Standard access logs generated by nginx: https://docs.nginx.com/nginx/admin-guide/monitoring/logging/
logfiles name: access.log and error.log
logfile location:
/srv/backend/nginx/logs/access.log
/srv/backend/nginx/logs/error.log
encoding: UTF-8
logfile format: text
content: standard access log and error log messages
example access log and error log messages: